Duke Energy 2015 Annual Report Download - page 141
Download and view the complete annual report
Please find page 141 of the 2015 Duke Energy annual report below. You can navigate through the pages in the report by either clicking on the pages listed below, or by using the keyword search tool below to find specific information within the annual report.-
 1
1 -
2
-
3
-
4
-
5
-
6
-
7
-
8
-
9
-
10
-
11
-
12
-
13
-
14
-
15
-
16
-
17
-
18
-
19
-
20
-
21
-
22
-
23
-
24
-
25
-
26
-
27
-
28
-
29
-
30
-
31
-
32
-
33
-
34
-
35
-
36
-
37
-
38
-
39
-
40
-
41
-
42
-
43
-
44
-
45
-
46
-
47
-
48
-
49
-
50
-
51
-
52
-
53
-
54
-
55
-
56
-
57
-
58
-
59
-
60
-
61
-
62
-
63
-
64
-
65
-
66
-
67
-
68
-
69
-
70
-
71
-
72
-
73
-
74
-
75
-
76
-
77
-
78
-
79
-
80
-
81
-
82
-
83
-
84
-
85
-
86
-
87
-
88
-
89
-
90
-
91
-
92
-
93
-
94
-
95
-
96
-
97
-
98
-
99
-
100
-
101
-
102
-
103
-
104
-
105
-
106
-
107
-
108
-
109
-
110
-
111
-
112
-
113
-
114
-
115
-
116
-
117
-
118
-
119
-
120
-
121
-
122
-
123
-
124
-
125
-
126
-
127
-
128
-
129
-
130
-
 131
131 -
 132
132 -
 133
133 -
 134
134 -
 135
135 -
 136
136 -
 137
137 -
 138
138 -
 139
139 -
 140
140 -
 141
141 -
 142
142 -
 143
143 -
 144
144 -
 145
145 -
 146
146 -
 147
147 -
 148
148 -
 149
149 -
 150
150 -
 151
151 -
152
-
153
-
154
-
155
-
156
-
157
-
158
-
159
-
160
-
161
-
162
-
163
-
164
-
165
-
166
-
167
-
168
-
169
-
170
-
171
-
172
-
173
-
174
-
175
-
176
-
177
-
178
-
179
-
180
-
181
-
182
-
183
-
184
-
185
-
186
-
187
-
188
-
189
-
190
-
191
-
192
-
193
-
194
-
195
-
196
-
197
-
198
-
199
-
200
-
201
-
202
-
203
-
204
-
205
-
206
-
207
-
208
-
209
-
210
-
211
-
212
-
213
-
214
-
215
-
216
-
217
-
218
-
219
-
220
-
221
-
222
-
223
-
224
-
225
-
226
-
227
-
228
-
229
-
230
-
231
-
232
-
233
-
234
-
235
-
236
-
237
-
238
-
239
-
240
-
241
-
242
-
243
-
244
-
245
-
246
-
247
-
248
-
249
-
250
-
251
-
252
-
253
-
254
-
255
-
256
-
257
-
258
-
259
-
260
-
261
-
262
-
263
-
264
 |
 |

121
PART II
DUKE ENERGY CORPORATION • DUKE ENERGY CAROLINAS, LLC • PROGRESS ENERGY, INC. •
DUKE ENERGY PROGRESS, LLC • DUKE ENERGY FLORIDA, LLC • DUKE ENERGY OHIO, INC. • DUKE ENERGY INDIANA, INC.
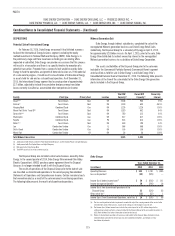
Combined Notes to Consolidated Financial Statements – (Continued)
4. REGULATORY MATTERS
REGULATORY ASSETS AND LIABILITIES
The Duke Energy Registrants record regulatory assets and liabilities that result from the ratemaking process. See Note 1 for further information.
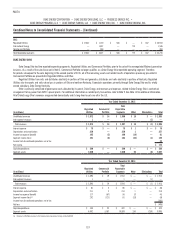
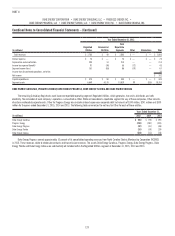
The following tables present the regulatory assets and liabilities recorded on the Consolidated Balance Sheets.
December 31, 2015
(in millions)
Duke
Energy
Duke
Energy
Carolinas
Progress
Energy
Duke
Energy
Progress
Duke
Energy
Florida
Duke
Energy
Ohio
Duke
Energy
Indiana
Regulatory Assets
Asset retirement obligations – coal ash $ 2,555 $1,120 $1,394 $1,386 $ 8 $ 4 $ 37
Asset retirement obligations – nuclear and other 838 104 487 195 292 — —
Accrued pension and OPEB 2,151 479 807 366 441 139 220
Retired generation facilities 509 49 409 179 230 — 51
Debt fair value adjustment 1,191 — — — — — —
Net regulatory asset related to income taxes 1,075 564 318 106 212 55 120
Nuclear asset securitizable balance, net 1,237 — 1,237 — 1,237 — —
Hedge costs and other deferrals 571 127 410 171 239 7 27
Demand side management (DSM)/Energy efficiency (EE) 340 80 250 237 13 10 —
Grid Modernization 68 — — — — 68 —
Vacation accrual 192 79 38 38 — 5 10
Deferred fuel and purchased power 151 21 129 93 36 1 —
Nuclear deferral 245 107 138 62 76 — —
Post-in-service carrying costs and deferred operating expenses 383 97 38 38 — 21 227
Gasification services agreement buyout 32 — — — — — 32
Transmission expansion obligation 72 — — — — 72 —
Manufactured gas plant (MGP) 104 — — — — 104 —
NCEMPA deferrals 21 — 21 21 — — —
East Bend deferrals 16 — — — — 16 —
Other 499 244 121 82 39 31 94
Total regulatory assets 12,250 3,071 5,797 2,974 2,823 533 818
Less: current portion 877 305 362 264 98 36 102
Total noncurrent regulatory assets $11,373 $2,766 $5,435 $2,710 $2,725 $497 $716
December 31, 2015
(in millions)
Duke
Energy
Duke
Energy
Carolinas
Progress
Energy
Duke
Energy
Progress
Duke
Energy
Florida
Duke
Energy
Ohio
Duke
Energy
Indiana
Regulatory Liabilities
Costs of removal $ 5,329 $2,413 $2,078 $1,725 $ 353 $ 222 $616
Amounts to be refunded to customers 71 — — — — — 71
Storm reserve 150 24 125 — 125 1 —
Accrued pension and OPEB 288 68 51 25 26 21 83
Deferred fuel and purchased power 311 55 255 58 197 1 —
Other 506 281 164 155 8 12 46
Total regulatory liabilities 6,655 2,841 2,673 1,963 709 257 816
Less: current portion 400 39 286 85 200 12 62
Total noncurrent regulatory liabilities $ 6,255 $2,802 $2,387 $1,878 $ 509 $ 245 $754