Duke Energy 2015 Annual Report Download - page 186
Download and view the complete annual report
Please find page 186 of the 2015 Duke Energy annual report below. You can navigate through the pages in the report by either clicking on the pages listed below, or by using the keyword search tool below to find specific information within the annual report.-
 1
1 -
2
-
3
-
4
-
5
-
6
-
7
-
8
-
9
-
10
-
11
-
12
-
13
-
14
-
15
-
16
-
17
-
18
-
19
-
20
-
21
-
22
-
23
-
24
-
25
-
26
-
27
-
28
-
29
-
30
-
31
-
32
-
33
-
34
-
35
-
36
-
37
-
38
-
39
-
40
-
41
-
42
-
43
-
44
-
45
-
46
-
47
-
48
-
49
-
50
-
51
-
52
-
53
-
54
-
55
-
56
-
57
-
58
-
59
-
60
-
61
-
62
-
63
-
64
-
65
-
66
-
67
-
68
-
69
-
70
-
71
-
72
-
73
-
74
-
75
-
76
-
77
-
78
-
79
-
80
-
81
-
82
-
83
-
84
-
85
-
86
-
87
-
88
-
89
-
90
-
91
-
92
-
93
-
94
-
95
-
96
-
97
-
98
-
99
-
100
-
101
-
102
-
103
-
104
-
105
-
106
-
107
-
108
-
109
-
110
-
111
-
112
-
113
-
114
-
115
-
116
-
117
-
118
-
119
-
120
-
121
-
122
-
123
-
124
-
125
-
126
-
127
-
128
-
129
-
130
-
131
-
132
-
133
-
134
-
135
-
136
-
137
-
138
-
139
-
140
-
141
-
142
-
143
-
144
-
145
-
146
-
147
-
148
-
149
-
150
-
151
-
152
-
153
-
154
-
155
-
156
-
157
-
158
-
159
-
160
-
161
-
162
-
163
-
164
-
165
-
166
-
167
-
168
-
169
-
170
-
171
-
172
-
173
-
174
-
175
-
 176
176 -
 177
177 -
 178
178 -
 179
179 -
 180
180 -
 181
181 -
 182
182 -
 183
183 -
 184
184 -
 185
185 -
 186
186 -
 187
187 -
 188
188 -
 189
189 -
 190
190 -
 191
191 -
 192
192 -
 193
193 -
 194
194 -
 195
195 -
 196
196 -
197
-
198
-
199
-
200
-
201
-
202
-
203
-
204
-
205
-
206
-
207
-
208
-
209
-
210
-
211
-
212
-
213
-
214
-
215
-
216
-
217
-
218
-
219
-
220
-
221
-
222
-
223
-
224
-
225
-
226
-
227
-
228
-
229
-
230
-
231
-
232
-
233
-
234
-
235
-
236
-
237
-
238
-
239
-
240
-
241
-
242
-
243
-
244
-
245
-
246
-
247
-
248
-
249
-
250
-
251
-
252
-
253
-
254
-
255
-
256
-
257
-
258
-
259
-
260
-
261
-
262
-
263
-
264
 |
 |

166
PART II
DUKE ENERGY CORPORATION • DUKE ENERGY CAROLINAS, LLC • PROGRESS ENERGY, INC. •
DUKE ENERGY PROGRESS, LLC • DUKE ENERGY FLORIDA, LLC • DUKE ENERGY OHIO, INC. • DUKE ENERGY INDIANA, INC.
Combined Notes to Consolidated Financial Statements – (Continued)
DUKE ENERGY PROGRESS
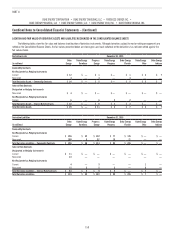
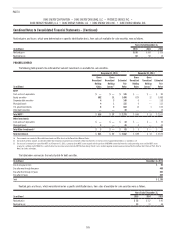
The following table presents the estimated fair value of investments in available-for-sale securities.
December 31, 2015 December 31, 2014
(in millions)
Gross
Unrealized
Holding
Gains
Gross
Unrealized
Holding
Losses(b)
Estimated
Fair
Value
Gross
Unrealized
Holding
Gains
Gross
Unrealized
Holding
Losses(b)
Estimated
Fair
Value
NDTF
Cash and cash equivalents $ — $ — $ 110 $ — $ — $ 50
Equity securities 596 25 1,178 612 10 1,171
Corporate debt securities 3 2 96 5 — 97
Municipal bonds 4 1 150 4 — 120
U.S. government bonds 6 2 486 9 1 265
Other debt securities — — 18 — — 8
Total NDTF(c) $ 609 $ 30 $ 2,038 $ 630 $ 11 $ 1,711
Other Investments
Cash and cash equivalents $ — $ — $ 1 $ — $ — $ —
Total Other Investments(a) $ — $ — $ 1 $ — $ — $ —
Total Investments $ 609 $ 30 $ 2,039 $ 630 $ 11 $ 1,711
(a) These amounts are recorded in Other with Investments and Other Assets on the Consolidated Balance Sheets.
(b) Substantially all these amounts represent other-than-temporary impairments on investments within Investment Trusts that have been recognized immediately as a regulatory asset.
(c) As of December 31, 2015, the estimated fair value of the NDTF includes NDTF assets acquired with the purchase of NCEMPA’s ownership interest in certain generating assets. Refer to Note 2 for further information.
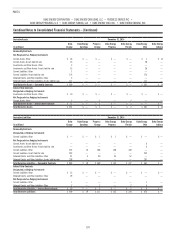
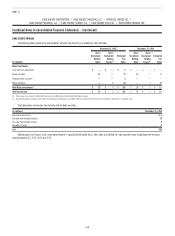
The table below summarizes the maturity date for debt securities.
(in millions) December 31, 2015
Due in one year or less $ 15
Due after one through five years 285
Due after five through 10 years 206
Due after 10 years 244
Total $750
Realized gains and losses, which were determined on a specific identification basis, from sales of available-for-sale securities were as follows.
Years Ended December 31,
(in millions) 2015 2014 2013
Realized gains $26 $ 19 $ 58
Realized losses 11 5 26