Duke Energy 2015 Annual Report Download - page 172
Download and view the complete annual report
Please find page 172 of the 2015 Duke Energy annual report below. You can navigate through the pages in the report by either clicking on the pages listed below, or by using the keyword search tool below to find specific information within the annual report.-
 1
1 -
2
-
3
-
4
-
5
-
6
-
7
-
8
-
9
-
10
-
11
-
12
-
13
-
14
-
15
-
16
-
17
-
18
-
19
-
20
-
21
-
22
-
23
-
24
-
25
-
26
-
27
-
28
-
29
-
30
-
31
-
32
-
33
-
34
-
35
-
36
-
37
-
38
-
39
-
40
-
41
-
42
-
43
-
44
-
45
-
46
-
47
-
48
-
49
-
50
-
51
-
52
-
53
-
54
-
55
-
56
-
57
-
58
-
59
-
60
-
61
-
62
-
63
-
64
-
65
-
66
-
67
-
68
-
69
-
70
-
71
-
72
-
73
-
74
-
75
-
76
-
77
-
78
-
79
-
80
-
81
-
82
-
83
-
84
-
85
-
86
-
87
-
88
-
89
-
90
-
91
-
92
-
93
-
94
-
95
-
96
-
97
-
98
-
99
-
100
-
101
-
102
-
103
-
104
-
105
-
106
-
107
-
108
-
109
-
110
-
111
-
112
-
113
-
114
-
115
-
116
-
117
-
118
-
119
-
120
-
121
-
122
-
123
-
124
-
125
-
126
-
127
-
128
-
129
-
130
-
131
-
132
-
133
-
134
-
135
-
136
-
137
-
138
-
139
-
140
-
141
-
142
-
143
-
144
-
145
-
146
-
147
-
148
-
149
-
150
-
151
-
152
-
153
-
154
-
155
-
156
-
157
-
158
-
159
-
160
-
161
-
 162
162 -
 163
163 -
 164
164 -
 165
165 -
 166
166 -
 167
167 -
 168
168 -
 169
169 -
 170
170 -
 171
171 -
 172
172 -
 173
173 -
 174
174 -
 175
175 -
 176
176 -
 177
177 -
 178
178 -
 179
179 -
 180
180 -
 181
181 -
 182
182 -
183
-
184
-
185
-
186
-
187
-
188
-
189
-
190
-
191
-
192
-
193
-
194
-
195
-
196
-
197
-
198
-
199
-
200
-
201
-
202
-
203
-
204
-
205
-
206
-
207
-
208
-
209
-
210
-
211
-
212
-
213
-
214
-
215
-
216
-
217
-
218
-
219
-
220
-
221
-
222
-
223
-
224
-
225
-
226
-
227
-
228
-
229
-
230
-
231
-
232
-
233
-
234
-
235
-
236
-
237
-
238
-
239
-
240
-
241
-
242
-
243
-
244
-
245
-
246
-
247
-
248
-
249
-
250
-
251
-
252
-
253
-
254
-
255
-
256
-
257
-
258
-
259
-
260
-
261
-
262
-
263
-
264
 |
 |

152
PART II
DUKE ENERGY CORPORATION • DUKE ENERGY CAROLINAS, LLC • PROGRESS ENERGY, INC. •
DUKE ENERGY PROGRESS, LLC • DUKE ENERGY FLORIDA, LLC • DUKE ENERGY OHIO, INC. • DUKE ENERGY INDIANA, INC.
Combined Notes To Consolidated Financial Statements – (Continued)
11. GOODWILL AND INTANGIBLE ASSETS
GOODWILL
The following table presents goodwill by reportable operating segment for
Duke Energy.
Duke Energy
(in millions)
Regulated
Utilities
International
Energy
Commercial
Portfolio Total
Goodwill at December 31, 2014(a) $ 15,950 $ 307 $ 64 $ 16,321
Foreign exchange and other
changes — (36) — (36)
Acquisitions — — 58 58
Goodwill at December 31, 2015 $ 15,950 $ 271 $ 122 $ 16,343
(a) Excludes fully impaired Goodwill related to the nonregulated Midwest Generation business which was sold
in the second quarter of 2015. See Note 2 for further information related to the sale.
Duke Energy Ohio
Duke Energy Ohio’s Goodwill balance of $920 million is included in
the Regulated Utilities operating segment and presented net of accumulated
impairment charges of $216 million on the Consolidated Balance Sheets at
December 31, 2015 and 2014.
Progress Energy
Progress Energy’s Goodwill is included in the Regulated Utilities operating
segment and there are no accumulated impairment charges.
Impairment Testing
Duke Energy, Duke Energy Ohio and Progress Energy perform annual
goodwill impairment tests each year as of August 31. Duke Energy, Duke Energy
Ohio and Progress Energy update their test between annual tests if events or
circumstances occur that would more likely than not reduce the fair value of a
reporting unit below its carrying value. As the fair value of Duke Energy, Duke
Energy Ohio and Progress Energy’s reporting units exceeded their respective
carrying values at the date of the annual impairment analysis, no impairment
charges were recorded in 2015.
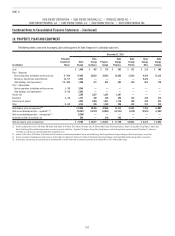
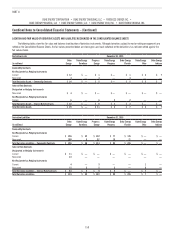
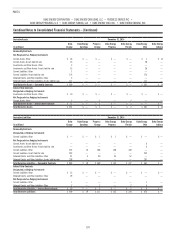
INTANGIBLE ASSETS
The following tables show the carrying amount and accumulated amortization of intangible assets within Other on the Consolidated Balance Sheets of the Duke
Energy Registrants at December 31, 2015 and 2014.
December 31, 2015
(in millions)
Duke
Energy
Duke
Energy
Carolinas
Progress
Energy
Duke
Energy
Progress
Duke
Energy
Florida
Duke
Energy
Ohio
Duke
Energy
Indiana
Emission allowances $ 20 $ 1 $ 6 $ 2 $ 4 $ — $ 14
Renewable energy certificates 116 30 80 80 — 5 —
Gas, coal and power contracts 24 — — — — — 24
Wind development rights 115 — — — — — —
Other 68 — — — — — —
Total gross carrying amounts 343 31 86 82 4 5 38
Accumulated amortization – gas, coal and power contracts (16) — — — — — (16)
Accumulated amortization – wind development rights (18) — — — — — —
Accumulated amortization – other (24) — — — — — —
Total accumulated amortization (58) — — — — — (16)
Total intangible assets, net $ 285 $ 31 $86 $82 $ 4 $ 5 $ 22