Duke Energy 2015 Annual Report Download - page 230
Download and view the complete annual report
Please find page 230 of the 2015 Duke Energy annual report below. You can navigate through the pages in the report by either clicking on the pages listed below, or by using the keyword search tool below to find specific information within the annual report.-
 1
1 -
2
-
3
-
4
-
5
-
6
-
7
-
8
-
9
-
10
-
11
-
12
-
13
-
14
-
15
-
16
-
17
-
18
-
19
-
20
-
21
-
22
-
23
-
24
-
25
-
26
-
27
-
28
-
29
-
30
-
31
-
32
-
33
-
34
-
35
-
36
-
37
-
38
-
39
-
40
-
41
-
42
-
43
-
44
-
45
-
46
-
47
-
48
-
49
-
50
-
51
-
52
-
53
-
54
-
55
-
56
-
57
-
58
-
59
-
60
-
61
-
62
-
63
-
64
-
65
-
66
-
67
-
68
-
69
-
70
-
71
-
72
-
73
-
74
-
75
-
76
-
77
-
78
-
79
-
80
-
81
-
82
-
83
-
84
-
85
-
86
-
87
-
88
-
89
-
90
-
91
-
92
-
93
-
94
-
95
-
96
-
97
-
98
-
99
-
100
-
101
-
102
-
103
-
104
-
105
-
106
-
107
-
108
-
109
-
110
-
111
-
112
-
113
-
114
-
115
-
116
-
117
-
118
-
119
-
120
-
121
-
122
-
123
-
124
-
125
-
126
-
127
-
128
-
129
-
130
-
131
-
132
-
133
-
134
-
135
-
136
-
137
-
138
-
139
-
140
-
141
-
142
-
143
-
144
-
145
-
146
-
147
-
148
-
149
-
150
-
151
-
152
-
153
-
154
-
155
-
156
-
157
-
158
-
159
-
160
-
161
-
162
-
163
-
164
-
165
-
166
-
167
-
168
-
169
-
170
-
171
-
172
-
173
-
174
-
175
-
176
-
177
-
178
-
179
-
180
-
181
-
182
-
183
-
184
-
185
-
186
-
187
-
188
-
189
-
190
-
191
-
192
-
193
-
194
-
195
-
196
-
197
-
198
-
199
-
200
-
201
-
202
-
203
-
204
-
205
-
206
-
207
-
208
-
209
-
210
-
211
-
212
-
213
-
214
-
215
-
216
-
217
-
218
-
219
-
 220
220 -
 221
221 -
 222
222 -
 223
223 -
 224
224 -
 225
225 -
 226
226 -
 227
227 -
 228
228 -
 229
229 -
 230
230 -
 231
231 -
 232
232 -
 233
233 -
 234
234 -
 235
235 -
 236
236 -
 237
237 -
 238
238 -
 239
239 -
 240
240 -
241
-
242
-
243
-
244
-
245
-
246
-
247
-
248
-
249
-
250
-
251
-
252
-
253
-
254
-
255
-
256
-
257
-
258
-
259
-
260
-
261
-
262
-
263
-
264
 |
 |

210
PART II
DUKE ENERGY CORPORATION • DUKE ENERGY CAROLINAS, LLC • PROGRESS ENERGY, INC. •
DUKE ENERGY PROGRESS, LLC. • DUKE ENERGY FLORIDA, LLC. • DUKE ENERGY OHIO, INC. • DUKE ENERGY INDIANA, INC.
Combined Notes to Consolidated Financial Statements – (Continued)
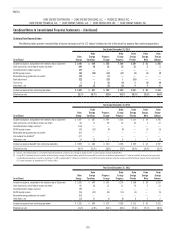
PROGRESS ENERGY
(in millions)
First
Quarter
Second
Quarter
Third
Quarter
Fourth
Quarter Total
2015
Operating revenues $2,536 $2,476 $2,929 $2,336 $10,277
Operating income 549 504 756 351 2,160
Income from continuing operations 264 217 452 132 1,065
Net income 263 217 451 131 1,062
Net income attributable to Parent 260 215 448 128 1,051
2014
Operating revenues $2,541 $2,421 $2,863 $2,341 $10,166
Operating income 477 488 665 388 2,018
Income from continuing operations 204 207 330 139 880
Net income 203 202 330 139 874
Net income attributable to Parent 202 202 329 136 869
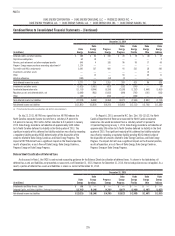
The following table includes unusual or infrequently occurring items in
each quarter during the two most recently completed fiscal years. All amounts
discussed below are pretax.
(in millions)
First
Quarter
Second
Quarter
Third
Quarter
Fourth
Quarter Total
2015
Costs to Achieve, Mergers $ (8) $ (8) $ (8) $ (10) $ (34)
Ash Basin Settlement and Penalties
(see Note 5) — — (6) — (6)
Cost Savings Initiatives (see Note 19) — — — (36) (36)
Total $ (8) $ (8) $ (14) $ (46) $ (76)
2014
Costs to Achieve, Mergers $(19) $ (12) $ (21) $ (13) $ (65)
Coal Ash Plea Agreements Reserve
(see Note 5) — — — (30) (30)
Total $(19) $ (12) $ (21) $ (43) $ (95)
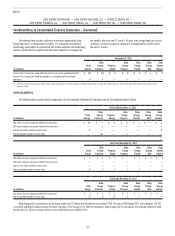
DUKE ENERGY PROGRESS
(in millions)
First
Quarter
Second
Quarter
Third
Quarter
Fourth
Quarter Total
2015
Operating revenues $1,449 $1,193 $1,488 $1,160 $ 5,290
Operating income 316 184 394 130 1,024
Net income 183 85 229 69 566
2014
Operating revenues $1,422 $1,191 $1,367 $1,196 $ 5,176
Operating income 258 212 285 180 935
Net income 133 101 157 76 467
The following table includes unusual or infrequently occurring items
in each quarter during the two most recently completed fiscal years. All
amounts discussed below are pretax.
(in millions)
First
Quarter
Second
Quarter
Third
Quarter
Fourth
Quarter Total
2015
Costs to Achieve, Mergers $ (5) $ (5) $ (6) $ (6) $ (22)
Ash Basin Settlement and Penalties
(see Note 5) — — (6) — (6)
Cost Savings Initiatives (see Note 19) — — — (28) (28)
Total $ (5) $ (5) $ (12) $ (34) $ (56)
2014
Costs to Achieve, Mergers $ (14) $ (3) $ (15) $ (10) $ (42)
Coal Ash Plea Agreements Reserve
(see Note 5) — — — (30) (30)
Total $ (14) $ (3) $ (15) $ (40) $ (72)
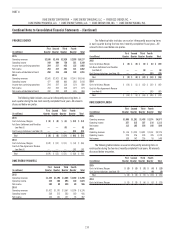
DUKE ENERGY FLORIDA
(in millions)
First
Quarter
Second
Quarter
Third
Quarter
Fourth
Quarter Total
2015
Operating revenues $1,086 $1,281 $1,436 $1,174 $4,977
Operating income 227 315 357 216 1,115
Net income 113 165 216 105 599
2014
Operating revenues $1,116 $1,225 $1,491 $1,143 $4,975
Operating income 219 276 378 205 1,078
Net income 108 142 205 93 548
The following table includes unusual or infrequently occurring items in
each quarter during the two most recently completed fiscal years. All amounts
discussed below are pretax.
(in millions)
First
Quarter
Second
Quarter
Third
Quarter
Fourth
Quarter Total
2015
Costs to Achieve, Mergers $ (3) $ (3) $ (3) $ (4) $ (13)
Cost Savings Initiatives (see Note 19) — — — (8) (8)
Total $ (3) $ (3) $ (3) $ (12) $ (21)
2014
Costs to Achieve, Mergers $ (5) $ (9) $ (6) $ (3) $ (23)