Duke Energy 2015 Annual Report Download - page 54
Download and view the complete annual report
Please find page 54 of the 2015 Duke Energy annual report below. You can navigate through the pages in the report by either clicking on the pages listed below, or by using the keyword search tool below to find specific information within the annual report.-
 1
1 -
2
-
3
-
4
-
5
-
6
-
7
-
8
-
9
-
10
-
11
-
12
-
13
-
14
-
15
-
16
-
17
-
18
-
19
-
20
-
21
-
22
-
23
-
24
-
25
-
26
-
27
-
28
-
29
-
30
-
31
-
32
-
33
-
34
-
35
-
36
-
37
-
38
-
39
-
40
-
41
-
42
-
43
-
 44
44 -
 45
45 -
 46
46 -
 47
47 -
 48
48 -
 49
49 -
 50
50 -
 51
51 -
 52
52 -
 53
53 -
 54
54 -
 55
55 -
 56
56 -
 57
57 -
 58
58 -
 59
59 -
 60
60 -
 61
61 -
 62
62 -
 63
63 -
 64
64 -
65
-
66
-
67
-
68
-
69
-
70
-
71
-
72
-
73
-
74
-
75
-
76
-
77
-
78
-
79
-
80
-
81
-
82
-
83
-
84
-
85
-
86
-
87
-
88
-
89
-
90
-
91
-
92
-
93
-
94
-
95
-
96
-
97
-
98
-
99
-
100
-
101
-
102
-
103
-
104
-
105
-
106
-
107
-
108
-
109
-
110
-
111
-
112
-
113
-
114
-
115
-
116
-
117
-
118
-
119
-
120
-
121
-
122
-
123
-
124
-
125
-
126
-
127
-
128
-
129
-
130
-
131
-
132
-
133
-
134
-
135
-
136
-
137
-
138
-
139
-
140
-
141
-
142
-
143
-
144
-
145
-
146
-
147
-
148
-
149
-
150
-
151
-
152
-
153
-
154
-
155
-
156
-
157
-
158
-
159
-
160
-
161
-
162
-
163
-
164
-
165
-
166
-
167
-
168
-
169
-
170
-
171
-
172
-
173
-
174
-
175
-
176
-
177
-
178
-
179
-
180
-
181
-
182
-
183
-
184
-
185
-
186
-
187
-
188
-
189
-
190
-
191
-
192
-
193
-
194
-
195
-
196
-
197
-
198
-
199
-
200
-
201
-
202
-
203
-
204
-
205
-
206
-
207
-
208
-
209
-
210
-
211
-
212
-
213
-
214
-
215
-
216
-
217
-
218
-
219
-
220
-
221
-
222
-
223
-
224
-
225
-
226
-
227
-
228
-
229
-
230
-
231
-
232
-
233
-
234
-
235
-
236
-
237
-
238
-
239
-
240
-
241
-
242
-
243
-
244
-
245
-
246
-
247
-
248
-
249
-
250
-
251
-
252
-
253
-
254
-
255
-
256
-
257
-
258
-
259
-
260
-
261
-
262
-
263
-
264
 |
 |

34
PART II
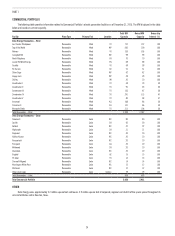
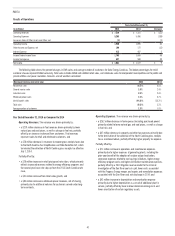
SEGMENT RESULTS
The remaining information presented in this discussion of results of operations is on a GAAP basis.
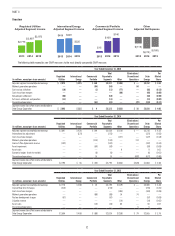
Regulated Utilities
(in millions)
Years Ended December 31,
2015 2014
Variance
2015 vs.
2014 2013
Variance
2014 vs.
2013
Operating Revenues $ 22,062 $ 22,271 $ (209) $ 20,910 $ 1,361
Operating Expenses 16,698 17,026 (328) 16,126 900
Gains on Sales of Other Assets and Other, net 11 4 7 7 (3)
Operating Income 5,375 5,249 126 4,791 458
Other Income and Expense, net 262 267 (5) 221 46
Interest Expense 1,097 1,093 4 986 107
Income Before Income Taxes 4,540 4,423 117 4,026 397
Income Tax Expense 1,647 1,628 19 1,522 106
Segment Income $ 2,893 $ 2,795 $ 98 $ 2,504 $ 291
Duke Energy Carolinas Gigawatt-Hours (GWh) sales 87,375 87,645 (270) 85,790 1,855
Duke Energy Progress GWh sales 64,881 62,871 2,010 60,204 2,667
Duke Energy Florida GWh sales 40,053 38,703 1,350 37,974 729
Duke Energy Ohio GWh sales 25,439 24,735 704 24,557 178
Duke Energy Indiana GWh sales 33,518 33,433 85 33,715 (282)
Total Regulated Utilities GWh sales 251,266 247,387 3,879 242,240 5,147
Net proportional MW capacity in operation 50,170 49,600 570 49,607 (7)
Year Ended December 31, 2015 as Compared to 2014
Regulated Utilities’ results increased due to an increase in wholesale
power margins, growth in retail sales, and increased retail pricing primarily
due to rate riders in most jurisdictions, including increased revenues related
to energy efficiency programs, and higher base rates primarily due to phasing
of 2013 rate cases. These drivers were partially offset by impairment expense
associated with the 2015 Edwardsport IGCC settlement, higher operations and
maintenance expenses, and increased depreciation and amortization expense.
The following is a detailed discussion of the variance drivers by line item.
Operating Revenues. The variance was driven primarily by:
• a $339 million decrease in fuel revenues driven primarily by overall
lower fuel rates for electric retail customers. Fuel revenues represent
sales to retail and wholesale customers; and
• a $131 million decrease in revenues to recover gross receipts taxes
due to the North Carolina Tax Simplification and Rate Reduction Act,
which terminated the collection of the North Carolina gross receipts tax
effective July 1, 2014.
Partially offset by:
• a $175 million increase in wholesale power revenues, primarily due to
additional volumes and capacity charges for customers served under
long-term contracts, including the NCEMPA wholesale contract that
became effective August 1, 2015; and
• a $79 million increase from retail sales growth (net of fuel revenue)
reflecting increased demand.
Operating Expenses. The variance was driven primarily by:
• a $422 million decrease in fuel expense (including purchased power
and natural gas purchases for resale) primarily due to (i) lower natural
gas and coal prices, (ii) lower volumes of coal and oil used in electric
generation and (iii) lower gas prices and volumes to full-service retail
gas customers, partially offset by (iv) higher volumes of natural gas
used in electric generation; and
• a $116 million decrease in property and other taxes primarily due to
the termination of the collection of the North Carolina gross receipts
tax as mentioned above, and the partial reversal of a sales tax reserve
recorded in 2014 at Duke Energy Indiana, partially offset by higher
property taxes across multiple jurisdictions and a favorable 2014 Ohio
gas excise tax settlement that did not recur in 2015.
Partially offset by:
• an $88 million impairment charge related to the 2015 Edwardsport
IGCC settlement. See Note 4 to the Consolidated Financial Statements,
“Regulatory Matters,” for additional information;
• a $56 million increase in operations and maintenance expense
primarily due to planned nuclear spending and the prior-year benefit of
the adoption of nuclear outage levelization, higher costs for customer
programs and distribution projects, and higher maintenance costs at
fossil generation stations primarily due to increased ownership interest
in assets acquired from NCEMPA, partially offset by a 2014 litigation
reserve related to the investigation of the Dan River coal ash spill (see
Note 5 to the Consolidated Financial Statements, “Commitments and
Contingencies,” for additional information), and lower storm restoration
costs; and
• a $55 million increase in depreciation and amortization expense
primarily due to increased plant in service.