Duke Energy 2015 Annual Report Download - page 183
Download and view the complete annual report
Please find page 183 of the 2015 Duke Energy annual report below. You can navigate through the pages in the report by either clicking on the pages listed below, or by using the keyword search tool below to find specific information within the annual report.-
 1
1 -
2
-
3
-
4
-
5
-
6
-
7
-
8
-
9
-
10
-
11
-
12
-
13
-
14
-
15
-
16
-
17
-
18
-
19
-
20
-
21
-
22
-
23
-
24
-
25
-
26
-
27
-
28
-
29
-
30
-
31
-
32
-
33
-
34
-
35
-
36
-
37
-
38
-
39
-
40
-
41
-
42
-
43
-
44
-
45
-
46
-
47
-
48
-
49
-
50
-
51
-
52
-
53
-
54
-
55
-
56
-
57
-
58
-
59
-
60
-
61
-
62
-
63
-
64
-
65
-
66
-
67
-
68
-
69
-
70
-
71
-
72
-
73
-
74
-
75
-
76
-
77
-
78
-
79
-
80
-
81
-
82
-
83
-
84
-
85
-
86
-
87
-
88
-
89
-
90
-
91
-
92
-
93
-
94
-
95
-
96
-
97
-
98
-
99
-
100
-
101
-
102
-
103
-
104
-
105
-
106
-
107
-
108
-
109
-
110
-
111
-
112
-
113
-
114
-
115
-
116
-
117
-
118
-
119
-
120
-
121
-
122
-
123
-
124
-
125
-
126
-
127
-
128
-
129
-
130
-
131
-
132
-
133
-
134
-
135
-
136
-
137
-
138
-
139
-
140
-
141
-
142
-
143
-
144
-
145
-
146
-
147
-
148
-
149
-
150
-
151
-
152
-
153
-
154
-
155
-
156
-
157
-
158
-
159
-
160
-
161
-
162
-
163
-
164
-
165
-
166
-
167
-
168
-
169
-
170
-
171
-
172
-
 173
173 -
 174
174 -
 175
175 -
 176
176 -
 177
177 -
 178
178 -
 179
179 -
 180
180 -
 181
181 -
 182
182 -
 183
183 -
 184
184 -
 185
185 -
 186
186 -
 187
187 -
 188
188 -
 189
189 -
 190
190 -
 191
191 -
 192
192 -
 193
193 -
194
-
195
-
196
-
197
-
198
-
199
-
200
-
201
-
202
-
203
-
204
-
205
-
206
-
207
-
208
-
209
-
210
-
211
-
212
-
213
-
214
-
215
-
216
-
217
-
218
-
219
-
220
-
221
-
222
-
223
-
224
-
225
-
226
-
227
-
228
-
229
-
230
-
231
-
232
-
233
-
234
-
235
-
236
-
237
-
238
-
239
-
240
-
241
-
242
-
243
-
244
-
245
-
246
-
247
-
248
-
249
-
250
-
251
-
252
-
253
-
254
-
255
-
256
-
257
-
258
-
259
-
260
-
261
-
262
-
263
-
264
 |
 |

163
PART II
DUKE ENERGY CORPORATION • DUKE ENERGY CAROLINAS, LLC • PROGRESS ENERGY, INC. •
DUKE ENERGY PROGRESS, LLC • DUKE ENERGY FLORIDA, LLC • DUKE ENERGY OHIO, INC. • DUKE ENERGY INDIANA, INC.
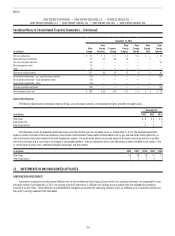
Combined Notes to Consolidated Financial Statements – (Continued)
Investments within the Investment Trusts generally qualify for regulatory
accounting, and accordingly realized and unrealized gains and losses are
deferred as a regulatory asset or liability. Certain investments held in Duke
Energy Florida’s NDTF were acquired in a settlement with FMJO and do
not qualify for regulatory accounting. Unrealized gains and losses on these
assets are included in other comprehensive income until realized, unless it
is determined the carrying value of an investment is other-than-temporarily
impaired, and realized gains and losses are included within Other income
and expense, net on the Consolidated Statements of Operations. The value of
these assets have not materially changed since the assets were acquired from
FMJO. As a result, there is no material impact on earnings of the Duke Energy
Registrants.
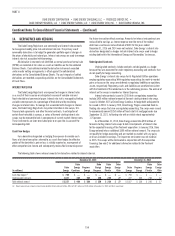
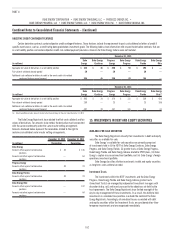
OTHER AVAILABLE-FOR-SALE SECURITIES
Unrealized gains and losses on all other available-for-sale securities are
included in other comprehensive income until realized, unless it is determined
the carrying value of an investment is other-than-temporarily impaired. If an
other-than-temporary impairment exists, the unrealized loss is included in
earnings based on the criteria discussed below.
The Duke Energy Registrants analyze all investment holdings each
reporting period to determine whether a decline in fair value should be
considered other-than-temporary. Criteria used to evaluate whether an
impairment associated with equity securities is other-than-temporary includes,
but is not limited to, (i) the length of time over which the market value has
been lower than the cost basis of the investment, (ii) the percentage decline
compared to the cost of the investment, and (iii) management’s intent and
ability to retain its investment for a period of time sufficient to allow for any
anticipated recovery in market value. If a decline in fair value is determined
to be other-than-temporary, the investment is written down to its fair value
through a charge to earnings.
If the entity does not have an intent to sell a debt security and it is not
more likely than not management will be required to sell the debt security before
the recovery of its cost basis, the impairment write-down to fair value would
be recorded as a component of other comprehensive income, except for when
it is determined a credit loss exists. In determining whether a credit loss exists,
management considers, among other things, (i) the length of time and the extent
to which the fair value has been less than the amortized cost basis, (ii) changes
in the financial condition of the issuer of the security, or in the case of an asset
backed security, the financial condition of the underlying loan obligors, (iii)
consideration of underlying collateral and guarantees of amounts by government
entities, (iv) ability of the issuer of the security to make scheduled interest or
principal payments, and (v) any changes to the rating of the security by rating
agencies. If a credit loss exists, the amount of impairment write-down to fair
value is split between credit loss and other factors. The amount related to credit
loss is recognized in earnings. The amount related to other factors is recognized
in other comprehensive income. There were no credit losses as of December 31,
2015 and 2014.
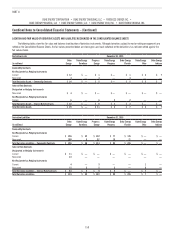
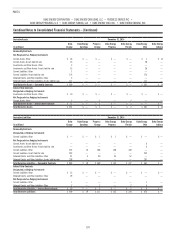
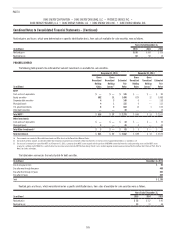
DUKE ENERGY
The following table presents the estimated fair value of investments in available-for-sale securities.
December 31, 2015 December 31, 2014
(in millions)
Gross
Unrealized
Holding
Gains
Gross
Unrealized
Holding
Losses(b)
Estimated
Fair
Value
Gross
Unrealized
Holding
Gains
Gross
Unrealized
Holding
Losses(b)
Estimated
Fair
Value
NDTF
Cash and cash equivalents $ — $ — $ 179 $ — $ — $ 136
Equity securities 1,823 58 3,590 1,926 29 3,650
Corporate debt securities 7 8 432 14 2 454
Municipal bonds 5 1 185 5 — 184
U.S. government bonds 11 5 1,254 19 2 978
Other debt securities — 4 177 1 2 147
Total NDTF(c) $ 1,846 $ 76 $ 5,817 $ 1,965 $ 35 $ 5,549
Other Investments
Cash and cash equivalents $ — $ — $ 29 $ — $ — $ 15
Equity securities 32 1 95 34 — 96
Corporate debt securities 1 3 92 1 1 58
Municipal bonds 3 1 74 3 1 76
U.S. government bonds — — 45 — — 27
Other debt securities — 2 62 1 1 80
Total Other Investments(a) $ 36 $ 7 $ 397 $ 39 $ 3 $ 352
Total Investments $ 1,882 $ 83 $ 6,214 $ 2,004 $ 38 $ 5,901
(a) These amounts are recorded in Other within Investments and Other Assets on the Consolidated Balance Sheets.
(b) Substantially all these amounts are considered other-than-temporary impairments on investments within Investment Trusts that have been recognized immediately as a regulatory asset.
(c) The increase in estimated fair value of the NDTF as of December 31, 2015, is primarily due to NDTF assets acquired with the purchase of NCEMPA’s ownership interest in certain generating assets and the NDTF assets
acquired in a settlement with FMJO. This is partially offset due to reimbursements from the NDTF for Duke Energy Florida’s costs related to ongoing decommissioning activity of the Crystal River Unit 3 Nuclear Plant. Refer to
Note 2 for further information.