Duke Energy 2015 Annual Report Download - page 59
Download and view the complete annual report
Please find page 59 of the 2015 Duke Energy annual report below. You can navigate through the pages in the report by either clicking on the pages listed below, or by using the keyword search tool below to find specific information within the annual report.-
 1
1 -
2
-
3
-
4
-
5
-
6
-
7
-
8
-
9
-
10
-
11
-
12
-
13
-
14
-
15
-
16
-
17
-
18
-
19
-
20
-
21
-
22
-
23
-
24
-
25
-
26
-
27
-
28
-
29
-
30
-
31
-
32
-
33
-
34
-
35
-
36
-
37
-
38
-
39
-
40
-
41
-
42
-
43
-
44
-
45
-
46
-
47
-
48
-
 49
49 -
 50
50 -
 51
51 -
 52
52 -
 53
53 -
 54
54 -
 55
55 -
 56
56 -
 57
57 -
 58
58 -
 59
59 -
 60
60 -
 61
61 -
 62
62 -
 63
63 -
 64
64 -
 65
65 -
 66
66 -
 67
67 -
 68
68 -
 69
69 -
70
-
71
-
72
-
73
-
74
-
75
-
76
-
77
-
78
-
79
-
80
-
81
-
82
-
83
-
84
-
85
-
86
-
87
-
88
-
89
-
90
-
91
-
92
-
93
-
94
-
95
-
96
-
97
-
98
-
99
-
100
-
101
-
102
-
103
-
104
-
105
-
106
-
107
-
108
-
109
-
110
-
111
-
112
-
113
-
114
-
115
-
116
-
117
-
118
-
119
-
120
-
121
-
122
-
123
-
124
-
125
-
126
-
127
-
128
-
129
-
130
-
131
-
132
-
133
-
134
-
135
-
136
-
137
-
138
-
139
-
140
-
141
-
142
-
143
-
144
-
145
-
146
-
147
-
148
-
149
-
150
-
151
-
152
-
153
-
154
-
155
-
156
-
157
-
158
-
159
-
160
-
161
-
162
-
163
-
164
-
165
-
166
-
167
-
168
-
169
-
170
-
171
-
172
-
173
-
174
-
175
-
176
-
177
-
178
-
179
-
180
-
181
-
182
-
183
-
184
-
185
-
186
-
187
-
188
-
189
-
190
-
191
-
192
-
193
-
194
-
195
-
196
-
197
-
198
-
199
-
200
-
201
-
202
-
203
-
204
-
205
-
206
-
207
-
208
-
209
-
210
-
211
-
212
-
213
-
214
-
215
-
216
-
217
-
218
-
219
-
220
-
221
-
222
-
223
-
224
-
225
-
226
-
227
-
228
-
229
-
230
-
231
-
232
-
233
-
234
-
235
-
236
-
237
-
238
-
239
-
240
-
241
-
242
-
243
-
244
-
245
-
246
-
247
-
248
-
249
-
250
-
251
-
252
-
253
-
254
-
255
-
256
-
257
-
258
-
259
-
260
-
261
-
262
-
263
-
264
 |
 |

39
PART II
Partially offset by:
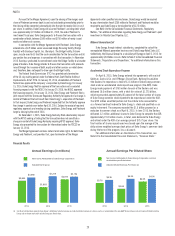
• an $18 million decrease in electric revenues due to lower wind production.
Operating Expenses. The variance was driven primarily by the $94 million
pretax impairment related to Ohio Valley Electric Corporation (OVEC) in 2014.
Other Income and Expense, net. The variance was primarily due to
lower equity earnings in the renewables portfolio due to lower wind production.
Interest Expense. The variance was driven primarily by capitalized
interest from increased spending on wind and solar projects.
Income Tax Benefit. The variance is primarily due to a decrease in pretax
losses and changes in state deferred taxes. The effective tax rates for the years
ended December 31, 2015 and 2014 were 103.4 percent and 75.5 percent,
respectively. The increase in the effective tax rate is primarily due to the impact of
the production tax credits for the renewables portfolio, partially offset by changes
to state apportionment factors on deferred taxes due to the Disposal Group sale.
Year Ended December 31, 2014 as Compared to 2013
Commercial Portfolio’s results were impacted by higher production
tax credits generation, higher production and lower operating costs by the
renewables business and a prior-year loss recognized on certain renewables
projects, partially offset by an impairment recorded for an intangible asset. The
following is a detailed discussion of the variance drivers by line item.
Operating Revenues. The variance was driven primarily by:
• an $8 million decrease in electric revenues for the Beckjord station,
which is not included in the Disposal Group, driven from lower
production as units have been retired;
• a $7 million decrease in net mark-to-market revenues on non-
qualifying power hedge contracts.
Partially offset by:
• a $16 million increase in electric revenues from higher production in the
renewables portfolio.
Operating Expenses. The variance was driven primarily by:
• a $94 million increase driven by an impairment related to OVEC. The
impairment reduced the carrying amount of OVEC to zero.
Partially offset by:
• an $18 million decrease in depreciation driven by discontinued
amortization of an intangible asset that was impaired and written off
in 2014 and extensions on the projected useful lives of assets in the
renewable portfolio;
• a $17 million decrease in fuel expense for the Beckjord station driven
by lower cost of coal from decreased production as units have been
retired;
• a $16 million decrease related to a 2013 legal settlement reserve
related to previously disposed businesses;
• a $10 million decrease in general and administrative costs;
• a $9 million decrease in operations and maintenance expense for the
renewables portfolio driven primarily by development cost reductions;
and
• a $6 million decrease in property tax expense driven by cost reductions
in the renewables portfolio resulting from a property tax abatement that
went into effect in the current year.
Losses on Sales of Other Assets and Other, net. The variance is
attributable to a loss recognized on the sale of certain renewable development
projects in 2013.
Other Income and Expense. The variance was primarily due to a net
gain recognized for the sale of certain renewable development assets and
increased equity earnings from higher production in the renewable wind portfolio.
Income Tax Benefit. The variance was primarily due to changes in state
deferred taxes and higher production tax credits in 2014 for the Renewables
portfolio. The effective tax rates for the years ended December 31, 2014 and
2013 were 75.5 percent and 62.8 percent, respectively.
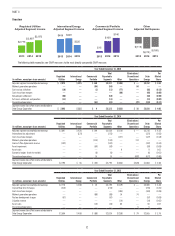
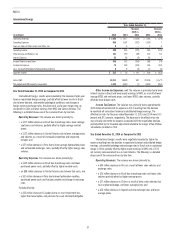
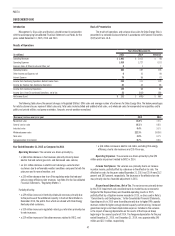
Other
Years Ended December 31,
2015 2014
Variance
2015 vs.
2014 2013
Variance
2014 vs.
2013(in millions)
Operating Revenues $ 123 $ 105 $ 18 $ 175 $ (70)
Operating Expenses 382 322 60 457 (135)
Gains (Losses) on Sales of Other Assets and Other, net 17 6 11 (3) 9
Operating Loss (242) (211) (31) (285) 74
Other Income and Expense, net 20 45 (25) 131 (86)
Interest Expense 393 400 (7) 416 (16)
Loss Before Income Taxes (615) (566) (49) (570) 4
Income Tax Benefit (303) (237) (66) (335) 98
Less: Income attributable to Noncontrolling Interests 10 5 5 3 2
Net Expense $ (322) $ (334) $ 12 $ (238) $ (96)