Duke Energy 2015 Annual Report Download - page 76
Download and view the complete annual report
Please find page 76 of the 2015 Duke Energy annual report below. You can navigate through the pages in the report by either clicking on the pages listed below, or by using the keyword search tool below to find specific information within the annual report.-
 1
1 -
2
-
3
-
4
-
5
-
6
-
7
-
8
-
9
-
10
-
11
-
12
-
13
-
14
-
15
-
16
-
17
-
18
-
19
-
20
-
21
-
22
-
23
-
24
-
25
-
26
-
27
-
28
-
29
-
30
-
31
-
32
-
33
-
34
-
35
-
36
-
37
-
38
-
39
-
40
-
41
-
42
-
43
-
44
-
45
-
46
-
47
-
48
-
49
-
50
-
51
-
52
-
53
-
54
-
55
-
56
-
57
-
58
-
59
-
60
-
61
-
62
-
63
-
64
-
65
-
 66
66 -
 67
67 -
 68
68 -
 69
69 -
 70
70 -
 71
71 -
 72
72 -
 73
73 -
 74
74 -
 75
75 -
 76
76 -
 77
77 -
 78
78 -
 79
79 -
 80
80 -
 81
81 -
 82
82 -
 83
83 -
 84
84 -
 85
85 -
 86
86 -
87
-
88
-
89
-
90
-
91
-
92
-
93
-
94
-
95
-
96
-
97
-
98
-
99
-
100
-
101
-
102
-
103
-
104
-
105
-
106
-
107
-
108
-
109
-
110
-
111
-
112
-
113
-
114
-
115
-
116
-
117
-
118
-
119
-
120
-
121
-
122
-
123
-
124
-
125
-
126
-
127
-
128
-
129
-
130
-
131
-
132
-
133
-
134
-
135
-
136
-
137
-
138
-
139
-
140
-
141
-
142
-
143
-
144
-
145
-
146
-
147
-
148
-
149
-
150
-
151
-
152
-
153
-
154
-
155
-
156
-
157
-
158
-
159
-
160
-
161
-
162
-
163
-
164
-
165
-
166
-
167
-
168
-
169
-
170
-
171
-
172
-
173
-
174
-
175
-
176
-
177
-
178
-
179
-
180
-
181
-
182
-
183
-
184
-
185
-
186
-
187
-
188
-
189
-
190
-
191
-
192
-
193
-
194
-
195
-
196
-
197
-
198
-
199
-
200
-
201
-
202
-
203
-
204
-
205
-
206
-
207
-
208
-
209
-
210
-
211
-
212
-
213
-
214
-
215
-
216
-
217
-
218
-
219
-
220
-
221
-
222
-
223
-
224
-
225
-
226
-
227
-
228
-
229
-
230
-
231
-
232
-
233
-
234
-
235
-
236
-
237
-
238
-
239
-
240
-
241
-
242
-
243
-
244
-
245
-
246
-
247
-
248
-
249
-
250
-
251
-
252
-
253
-
254
-
255
-
256
-
257
-
258
-
259
-
260
-
261
-
262
-
263
-
264
 |
 |

56
PART II
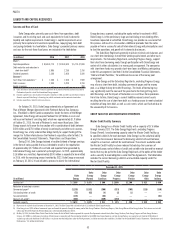
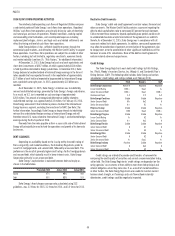
Cash Flow Information
The following table summarizes Duke Energy’s cash flows for the three
most recently completed fiscal years.
Years Ended December 31,
(in millions) 2015 2014 2013
Cash flows provided by (used in):
Operating activities $ 6,676 $ 6,586 $ 6,382
Investing activities (5,277) (5,373) (4,978)
Financing activities (2,578) (678) (1,327)
Net (decrease) increase in cash and cash
equivalents (1,179) 535 77
Cash and cash equivalents at beginning
of period 2,036 1,501 1,424
Cash and cash equivalents at end of period $ 857 $ 2,036 $ 1,501
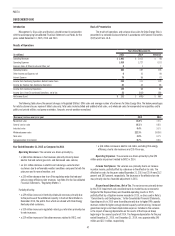
OPERATING CASH FLOWS
The following table summarizes key components of Duke Energy’s
operating cash flows for the three most recently completed fiscal year.
Years Ended December 31,
(in millions) 2015 2014 2013
Net income $ 2,831 $ 1,889 $ 2,676
Non-cash adjustments to net income 4,800 5,366 4,876
Contributions to qualified pension plans (302) — (250)
Payments for asset retirement obligations (346) (68) (12)
Working capital (307) (601) (908)
Net cash provided by operating activities $ 6,676 $ 6,586 $ 6,382
For the year ended December 31, 2015 compared to 2014, the variance
was driven primarily by:
• a $376 million increase in net income after non-cash adjustments
resulting from increased retail pricing due to rate riders and higher
base rates, increased wholesale net margins due to higher contracted
amounts and prices, a new wholesale contract with NCEMPA, retail
sales growth and
• a $294 million increase in cash flows from a working capital decrease
primarily due to lower current year receivables resulting from
unseasonably warmer weather in December 2015 and prior year under
collection of fuel and purchased power due to increased consumption.
Partially offset by:
• a $302 million increase in contributions to qualified pension plans and
• a $278 million increase in payments for asset retirement obligations.
For the year ended December 31, 2014 compared to 2013, the variance
was driven primarily by:
• a $204 million increase due to prior year contributions to qualified
pension plans, favorable retail pricing and rate riders and favorable
weather, partially offset by current year under collection of fuel and
purchased power costs and timing of cash payments for operations and
maintenance expenses.
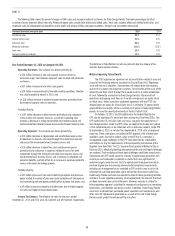
INVESTING CASH FLOWS
The following table summarizes key components of Duke Energy’s
investing cash flows for the three most recently completed fiscal years.
Years Ended December 31,
(in millions) 2015 2014 2013
Capital, investment and acquisition
expenditures $ (8,363) $ (5,528) $ (5,607)
Available for sale securities, net 323 173
Net proceeds from the sale of Midwest
generation business and sales of equity
investments and other assets 2,968 179 277
Other investing items 115 (47) 179
Net cash used in investing activities $ (5,277) $ (5,373) $ (4,978)
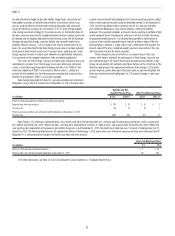
The primary use of cash related to investing activities is capital,
investment and acquisition expenditures, detailed by reportable business
segment in the following table.
Years Ended December 31,
(in millions) 2015 2014 2013
Regulated Utilities $ 6,974 $ 4,744 $ 5,049
Commercial Portfolio 1,131 555 268
International Energy 45 67 67
Other 213 162 223
Total capital, investment and acquisition
expenditures $ 8,363 $ 5,528 $ 5,607
For the year ended December 31, 2015 compared to 2014, the variance
was driven primarily by:
• a $2,789 million increase in proceeds mainly due to sale of the
nonregulated Midwest generation business to Dynegy and
• a $202 million return of collateral related to the Chilean acquisition in
2013. The collateral was used to repay a secured loan.
Partially offset by:
• a $2,835 million increase in capital, investment and acquisition
expenditures mainly due to the acquisition of NCEMPA ownership
interests in certain generating assets, fuel and spare parts inventory
jointly owned with and operated by Duke Energy Progress and growth
initiatives in electric and natural gas infrastructure, solar projects and
natural-gas fired generation.
For the year ended December 31, 2014 compared to 2013, the variance
was driven primarily by:
• a $192 million return of collateral related to the Chilean hydro
acquisition in 2013 and
• a $150 million decrease in net proceeds from sales and maturities of
available for sale securities, net of purchases.