Duke Energy 2015 Annual Report Download - page 51
Download and view the complete annual report
Please find page 51 of the 2015 Duke Energy annual report below. You can navigate through the pages in the report by either clicking on the pages listed below, or by using the keyword search tool below to find specific information within the annual report.-
 1
1 -
2
-
3
-
4
-
5
-
6
-
7
-
8
-
9
-
10
-
11
-
12
-
13
-
14
-
15
-
16
-
17
-
18
-
19
-
20
-
21
-
22
-
23
-
24
-
25
-
26
-
27
-
28
-
29
-
30
-
31
-
32
-
33
-
34
-
35
-
36
-
37
-
38
-
39
-
40
-
 41
41 -
 42
42 -
 43
43 -
 44
44 -
 45
45 -
 46
46 -
 47
47 -
 48
48 -
 49
49 -
 50
50 -
 51
51 -
 52
52 -
 53
53 -
 54
54 -
 55
55 -
 56
56 -
 57
57 -
 58
58 -
 59
59 -
 60
60 -
 61
61 -
62
-
63
-
64
-
65
-
66
-
67
-
68
-
69
-
70
-
71
-
72
-
73
-
74
-
75
-
76
-
77
-
78
-
79
-
80
-
81
-
82
-
83
-
84
-
85
-
86
-
87
-
88
-
89
-
90
-
91
-
92
-
93
-
94
-
95
-
96
-
97
-
98
-
99
-
100
-
101
-
102
-
103
-
104
-
105
-
106
-
107
-
108
-
109
-
110
-
111
-
112
-
113
-
114
-
115
-
116
-
117
-
118
-
119
-
120
-
121
-
122
-
123
-
124
-
125
-
126
-
127
-
128
-
129
-
130
-
131
-
132
-
133
-
134
-
135
-
136
-
137
-
138
-
139
-
140
-
141
-
142
-
143
-
144
-
145
-
146
-
147
-
148
-
149
-
150
-
151
-
152
-
153
-
154
-
155
-
156
-
157
-
158
-
159
-
160
-
161
-
162
-
163
-
164
-
165
-
166
-
167
-
168
-
169
-
170
-
171
-
172
-
173
-
174
-
175
-
176
-
177
-
178
-
179
-
180
-
181
-
182
-
183
-
184
-
185
-
186
-
187
-
188
-
189
-
190
-
191
-
192
-
193
-
194
-
195
-
196
-
197
-
198
-
199
-
200
-
201
-
202
-
203
-
204
-
205
-
206
-
207
-
208
-
209
-
210
-
211
-
212
-
213
-
214
-
215
-
216
-
217
-
218
-
219
-
220
-
221
-
222
-
223
-
224
-
225
-
226
-
227
-
228
-
229
-
230
-
231
-
232
-
233
-
234
-
235
-
236
-
237
-
238
-
239
-
240
-
241
-
242
-
243
-
244
-
245
-
246
-
247
-
248
-
249
-
250
-
251
-
252
-
253
-
254
-
255
-
256
-
257
-
258
-
259
-
260
-
261
-
262
-
263
-
264
 |
 |

31
PART II
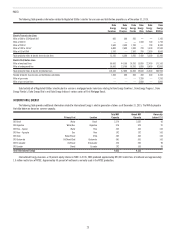
Growth Initiatives. Duke Energy will continue to pursue regulatory, state
and federal approval of the growth projects announced in 2015 and in earlier
periods. These projects will support long-term adjusted earnings growth and
support Duke Energy’s ability to continue providing its customers affordable,
reliable energy from an increasingly diverse generation portfolio.
Growth in the Regulated Utilities business is expected to be supported
by retail and wholesale load growth and significant investments. Duke Energy
expects to invest between $4 billion and $5 billion annually in the Regulated
Utilities business growth projects. Many of these projects will be recovered
through riders such as transmission and distribution expenditures in Indiana
and Ohio, as well as energy efficiency riders in the Carolinas.
The Commercial Portfolio renewables business is a significant component
of the Duke Energy growth strategy. Renewable projects enable Duke Energy
to respond to customer interest in clean energy resources while increasing
diversity in the generation portfolio. The portfolio of wind and solar is expected
to continue growing as between $1 billion and $2 billion of capital is expected to
be deployed over the next three years. Additionally, investments in the Atlantic
Coast Pipeline add approximately $1 billion of capital spending through 2017.
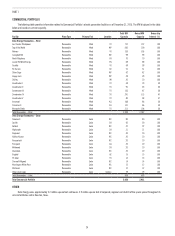
Duke Energy announced new growth initiatives in 2015, which include:
• Duke Energy Progress proposed an approximate $1 billion investment
in the Western Carolinas Modernization Project. The project will retire
and replace the existing coal units with two natural gas combined-cycle
280 MW fired generation projects, a utility scale solar power plant and
aggressive energy efficiency and demand-side management adoption
in the region.
• Commercial Portfolio acquired a 7.5 percent ownership interest in Sabal
Trail Transmission, LLC pipeline for a total estimated investment of
approximately $225 million upon completion of the project.
Cost Management. Duke Energy has a demonstrated track record of
driving efficiencies and productivity into the business. Duke Energy committed
to efficiencies following the merger with Progress Energy and is on track to meet
those commitments. Additionally, there is potential for more productivity and
efficiency gains leading to a target of 2016 operations and maintenance costs at
or below 2015 levels.
Continue the Coal Ash Management Strategy. Duke Energy will
continue the company’s compliance strategy with the Coal Ash Act and RCRA.
Duke Energy will update ash management plans to comply with the appropriate
regulations and expand excavation and other compliance work at additional
sites once plans and permits are approved.
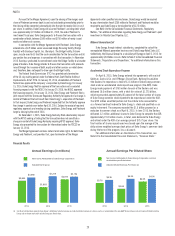
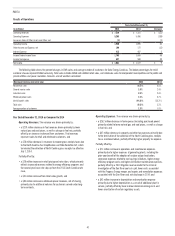
Results of Operations
In this section, Duke Energy provides analysis and discussion of earnings
and factors affecting earnings on both a GAAP and non-GAAP basis.
Management evaluates financial performance in part based on the
non-GAAP financial measures, adjusted earnings and adjusted diluted EPS.
These items are measured as income from continuing operations net of
income (loss) attributable to noncontrolling interests, adjusted for the dollar
and per share impact of mark-to-market impacts of economic hedges in
the Commercial Portfolio segment and special items including the operating
results of the Disposal Group classified as discontinued operations for
GAAP purposes. Special items represent certain charges and credits, which
management believes will not be recurring on a regular basis, although it is
reasonably possible such charges and credits could recur. Operating results
of the Disposal Group sold to Dynegy are reported as discontinued operations,
including a portion of the mark-to-market adjustments associated with
derivative contracts. Management believes that including the operating results
of the Disposal Group reported as discontinued operations better reflects its
financial performance and therefore has included these results in adjusted
earnings and adjusted diluted EPS prior to the sale of the Disposal Group.
Additionally, as a result of completing the sale of the Disposal Group during the
second quarter of 2015, state income tax expense increased as state income
tax apportionments changed. The additional tax expense was recognized in
Continuing Operations on a GAAP basis. This impact to state income taxes has
been excluded from the Commercial Portfolio segment for adjusted diluted EPS
purposes as management believes these impacts are incidental to the sale of
the Disposal Group. Derivative contracts are used in Duke Energy’s hedging
of a portion of the economic value of its generation assets in the Commercial
Portfolio segment. The mark-to-market impact of derivative contracts is
recognized in GAAP earnings immediately and, if associated with the Disposal
Group, classified as discontinued operations, as such derivative contracts do
not qualify for hedge accounting or regulatory treatment. The economic value
of generation assets is subject to fluctuations in fair value due to market
price volatility of input and output commodities (e.g., coal, electricity, natural
gas). Economic hedging involves both purchases and sales of those input and
output commodities related to generation assets. Operations of the generation
assets are accounted for under the accrual method. Management believes
excluding impacts of mark-to-market changes of the derivative contracts from
adjusted earnings until settlement better matches the financial impacts of
the derivative contract with the portion of economic value of the underlying
hedged asset. Management believes the presentation of adjusted earnings and
adjusted diluted EPS provides useful information to investors, as it provides
them an additional relevant comparison of Duke Energy’s performance across
periods. Management uses these non-GAAP financial measures for planning
and forecasting and for reporting results to the Duke Energy Board of Directors
(Board of Directors), employees, shareholders, analysts and investors
concerning Duke Energy’s financial performance. Adjusted diluted EPS is also
used as a basis for employee incentive bonuses. The most directly comparable
GAAP measures for adjusted earnings and adjusted diluted EPS are Net Income
Attributable to Duke Energy Corporation and Diluted EPS Attributable to Duke
Energy Corporation common shareholders, which include the dollar and per-
share impact of special items, mark-to-market impacts of economic hedges in
the Commercial Portfolio segment and discontinued operations.
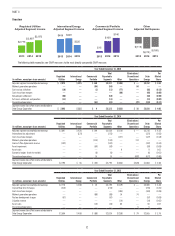
Management evaluates segment performance based on segment income.
Segment income is defined as income from continuing operations net of income
attributable to noncontrolling interests. Segment income, as discussed below,
includes intercompany revenues and expenses that are eliminated in the
Consolidated Financial Statements. Management also uses adjusted segment
income as a measure of historical and anticipated future segment performance.
Adjusted segment income is a non-GAAP financial measure, as it is based upon
segment income adjusted for the mark-to-market impacts of economic hedges
in the Commercial Portfolio segment and special items, including the operating
results of the Disposal Group classified as discontinued operations for GAAP
purposes. Management believes the presentation of adjusted segment income
as presented provides useful information to investors, as it provides them with
an additional relevant comparison of a segment’s performance across periods.
The most directly comparable GAAP measure for adjusted segment income is
segment income, which represents segment income from continuing operations,
including any special items and the mark-to-market impacts of economic
hedges in the Commercial Portfolio segment.
Duke Energy’s adjusted earnings, adjusted diluted EPS, and adjusted
segment income may not be comparable to similarly titled measures of another
company because other entities may not calculate the measures in the same
manner.
See Note 3 to the Consolidated Financial Statements, “Business
Segments,” for a discussion of Duke Energy’s segment structure.