Duke Energy 2015 Annual Report Download - page 13
Download and view the complete annual report
Please find page 13 of the 2015 Duke Energy annual report below. You can navigate through the pages in the report by either clicking on the pages listed below, or by using the keyword search tool below to find specific information within the annual report.-
 1
1 -
2
-
 3
3 -
 4
4 -
 5
5 -
 6
6 -
 7
7 -
 8
8 -
 9
9 -
 10
10 -
 11
11 -
 12
12 -
 13
13 -
 14
14 -
 15
15 -
 16
16 -
 17
17 -
 18
18 -
 19
19 -
 20
20 -
 21
21 -
 22
22 -
 23
23 -
24
-
25
-
26
-
27
-
28
-
29
-
30
-
31
-
32
-
33
-
34
-
35
-
36
-
37
-
38
-
39
-
40
-
41
-
42
-
43
-
44
-
45
-
46
-
47
-
48
-
49
-
50
-
51
-
52
-
53
-
54
-
55
-
56
-
57
-
58
-
59
-
60
-
61
-
62
-
63
-
64
-
65
-
66
-
67
-
68
-
69
-
70
-
71
-
72
-
73
-
74
-
75
-
76
-
77
-
78
-
79
-
80
-
81
-
82
-
83
-
84
-
85
-
86
-
87
-
88
-
89
-
90
-
91
-
92
-
93
-
94
-
95
-
96
-
97
-
98
-
99
-
100
-
101
-
102
-
103
-
104
-
105
-
106
-
107
-
108
-
109
-
110
-
111
-
112
-
113
-
114
-
115
-
116
-
117
-
118
-
119
-
120
-
121
-
122
-
123
-
124
-
125
-
126
-
127
-
128
-
129
-
130
-
131
-
132
-
133
-
134
-
135
-
136
-
137
-
138
-
139
-
140
-
141
-
142
-
143
-
144
-
145
-
146
-
147
-
148
-
149
-
150
-
151
-
152
-
153
-
154
-
155
-
156
-
157
-
158
-
159
-
160
-
161
-
162
-
163
-
164
-
165
-
166
-
167
-
168
-
169
-
170
-
171
-
172
-
173
-
174
-
175
-
176
-
177
-
178
-
179
-
180
-
181
-
182
-
183
-
184
-
185
-
186
-
187
-
188
-
189
-
190
-
191
-
192
-
193
-
194
-
195
-
196
-
197
-
198
-
199
-
200
-
201
-
202
-
203
-
204
-
205
-
206
-
207
-
208
-
209
-
210
-
211
-
212
-
213
-
214
-
215
-
216
-
217
-
218
-
219
-
220
-
221
-
222
-
223
-
224
-
225
-
226
-
227
-
228
-
229
-
230
-
231
-
232
-
233
-
234
-
235
-
236
-
237
-
238
-
239
-
240
-
241
-
242
-
243
-
244
-
245
-
246
-
247
-
248
-
249
-
250
-
251
-
252
-
253
-
254
-
255
-
256
-
257
-
258
-
259
-
260
-
261
-
262
-
263
-
264
 |
 |

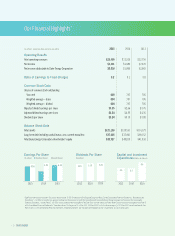
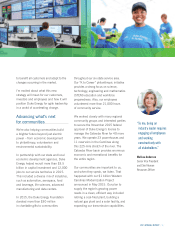
Duke Energy At A Glance
2015 ANNUAL REPORT / 11 /
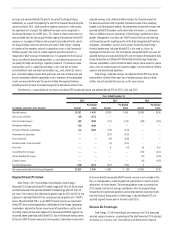
Generation Diversity (percent owned capacity)1Generation Diversity (percent owned capacity)1
Generated (net output gigawatt-hours (GWh))2
Customer Diversity (in billed GWh sales)2
Regulated Utilities consists of Duke Energy’s regulated
generation, electric and natural gas transmission and
distribution systems. Regulated Utilities generation portfolio is
a balanced mix of energy resources having different operating
characteristics and fuel sources designed to provide energy at
the lowest possible cost.
Electric Operations
Owns approximately 50,200 megawatts (MW) of
generating capacity
Service area covers about 95,000 square miles with
an estimated population of 24 million
Service to approximately 7.4 million residential,
commercial and industrial customers
263,900 miles of distribution lines and a
32,300-mile transmission system
Natural Gas Operations
Regulated natural gas transmission and distribution services
to approximately 525,000 customers in southwestern Ohio
and northern Kentucky
Commercial Portfolio primarily builds, develops, and operates
wind and solar renewable generation and energy transmission
projects throughout the continental U.S. The portfolio includes
nonregulated renewable energy, electric transmission, natural
gas infrastructure and energy storage businesses.
Commercial Portfolio’s renewable energy includes utility-scale
wind and solar generation assets which total more than 2,500
MW across 12 states from more than 22 wind farms and 38
commercial solar farms. Revenues are primarily generated by
selling the power through long-term contracts to utilities, electric
cooperatives, municipalities, and other customers.
Duke Energy currently has about 1,950 MW of wind and solar
energy in operation (pie chart excludes 538 MW, which are
from equity investments)
38%
Natural Gas/Fuel Oil
37% Coal
18% Nuclear
7% Hydro and Solar
36% Coal
34% Nuclear
29% Natural Gas/Fuel Oil
1% Hydro and Solar
100% Renewable
33% Residential
31% General Services
21% Industrial
15% Wholesale/Other
1
As of December 31, 2015.
2
For the year-ended December 31, 2015.
Regulated Utilities Commercial Portfolio
Generation Diversity (percent owned capacity)1
International Energy principally operates and manages power
generation facilities and engages in sales and marketing of electric
power, natural gas, and natural gas liquids outside the U.S. Its
activities principally target power generation in Latin America.
Additionally, International Energy owns a 25 percent interest in
National Methanol Company (NMC), a large regional producer of
methanol and methyl tertiary butyl ether (MTBE) located in Saudi
Arabia. In February 2016, Duke Energy announced it intends to
exit its International Energy business segment, excluding the
investment in NMC.
Owns, operates or has substantial interests in approximately
4,300 net MW of generation facilities
Nearly two-thirds of International Energy’s generating
capacity is hydroelectric
70% Hydro
22% Fuel Oil
6% Natural Gas
2% Coal
International Energy