Duke Energy 2015 Annual Report Download - page 220
Download and view the complete annual report
Please find page 220 of the 2015 Duke Energy annual report below. You can navigate through the pages in the report by either clicking on the pages listed below, or by using the keyword search tool below to find specific information within the annual report.-
 1
1 -
2
-
3
-
4
-
5
-
6
-
7
-
8
-
9
-
10
-
11
-
12
-
13
-
14
-
15
-
16
-
17
-
18
-
19
-
20
-
21
-
22
-
23
-
24
-
25
-
26
-
27
-
28
-
29
-
30
-
31
-
32
-
33
-
34
-
35
-
36
-
37
-
38
-
39
-
40
-
41
-
42
-
43
-
44
-
45
-
46
-
47
-
48
-
49
-
50
-
51
-
52
-
53
-
54
-
55
-
56
-
57
-
58
-
59
-
60
-
61
-
62
-
63
-
64
-
65
-
66
-
67
-
68
-
69
-
70
-
71
-
72
-
73
-
74
-
75
-
76
-
77
-
78
-
79
-
80
-
81
-
82
-
83
-
84
-
85
-
86
-
87
-
88
-
89
-
90
-
91
-
92
-
93
-
94
-
95
-
96
-
97
-
98
-
99
-
100
-
101
-
102
-
103
-
104
-
105
-
106
-
107
-
108
-
109
-
110
-
111
-
112
-
113
-
114
-
115
-
116
-
117
-
118
-
119
-
120
-
121
-
122
-
123
-
124
-
125
-
126
-
127
-
128
-
129
-
130
-
131
-
132
-
133
-
134
-
135
-
136
-
137
-
138
-
139
-
140
-
141
-
142
-
143
-
144
-
145
-
146
-
147
-
148
-
149
-
150
-
151
-
152
-
153
-
154
-
155
-
156
-
157
-
158
-
159
-
160
-
161
-
162
-
163
-
164
-
165
-
166
-
167
-
168
-
169
-
170
-
171
-
172
-
173
-
174
-
175
-
176
-
177
-
178
-
179
-
180
-
181
-
182
-
183
-
184
-
185
-
186
-
187
-
188
-
189
-
190
-
191
-
192
-
193
-
194
-
195
-
196
-
197
-
198
-
199
-
200
-
201
-
202
-
203
-
204
-
205
-
206
-
207
-
208
-
209
-
 210
210 -
 211
211 -
 212
212 -
 213
213 -
 214
214 -
 215
215 -
 216
216 -
 217
217 -
 218
218 -
 219
219 -
 220
220 -
 221
221 -
 222
222 -
 223
223 -
 224
224 -
 225
225 -
 226
226 -
 227
227 -
 228
228 -
 229
229 -
 230
230 -
231
-
232
-
233
-
234
-
235
-
236
-
237
-
238
-
239
-
240
-
241
-
242
-
243
-
244
-
245
-
246
-
247
-
248
-
249
-
250
-
251
-
252
-
253
-
254
-
255
-
256
-
257
-
258
-
259
-
260
-
261
-
262
-
263
-
264
 |
 |

200
PART II
DUKE ENERGY CORPORATION • DUKE ENERGY CAROLINAS, LLC • PROGRESS ENERGY, INC. •
DUKE ENERGY PROGRESS, LLC. • DUKE ENERGY FLORIDA, LLC. • DUKE ENERGY OHIO, INC. • DUKE ENERGY INDIANA, INC.
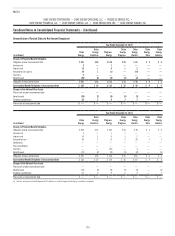
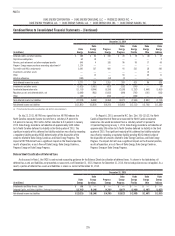
Combined Notes to Consolidated Financial Statements – (Continued)
December 31, 2014
(in millions) Total Fair Value Level 1 Level 2 Level 3
Not
Categorized(b)
Equity securities $2,346 $1,625 $ 3 $ — $ 718
Corporate debt securities 4,349 — 4,348 1 —
Short-term investment funds 333 171 162 — —
Partnership interests 298 — — — 298
Hedge funds 146 — — — 146
Real estate limited partnerships 104 — — — 104
U.S. government securities 917 — 916 1 —
Guaranteed investment contracts 32 — — 32 —
Governments bonds – foreign 44 — 44 — —
Cash 30 30 — — —
Government and commercial mortgage backed securities 9 — 9 — —
Net pending transactions and other investments 10 (10) 20 — —
Total assets(a) $8,618 $1,816 $5,502 $ 34 $ 1,266
(a) Duke Energy Carolinas, Progress Energy, Duke Energy Progress, Duke Energy Florida, Duke Energy Ohio and Duke Energy Indiana were allocated approximately 28 percent, 31 percent, 15 percent, 16 percent, 5 percent and
8 percent, respectively, of the Duke Energy Master Retirement Trust assets at December 31, 2014. Accordingly, all amounts included in the table above are allocable to the Subsidiary Registrants using these percentages.
(b) Certain investments are not categorized. These investments are measured based on the fair value of the underlying investments but may not be readily redeemable at that fair value.
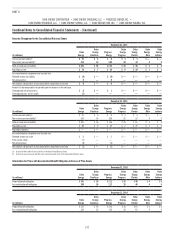
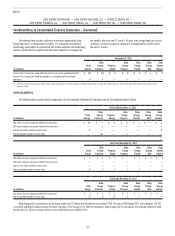
The following table provides a reconciliation of beginning and ending balances of assets of master trusts measured at fair value on a recurring basis where the
determination of fair value includes significant unobservable inputs (Level 3).
(in millions) 2015 2014
Balance at January 1 $ 34 $ 37
Sales (2) (4)
Total gains (losses) and other, net (1) 1
Balance at December 31 $ 31 $ 34
VEBA I
The following tables provide the fair value measurement amounts for VEBA I other post-retirement assets.
December 31, 2015
(in millions) Total Fair Value Level 1 Level 2 Level 3
Cash and cash equivalents $ 18 $— $ 18 $—
Equity securities 12 — 12 —
Debt securities 12 — 12 —
Total assets $ 42 $— $ 42 $—
December 31, 2014
(in millions) Total Fair Value Level 1 Level 2 Level 3
Cash and cash equivalents $ 21 $ — $ 21 $ —
Equity securities 14 — 14 —
Debt securities 13 — 13 —
Total assets $ 48 $ — $ 48 $ —
EMPLOYEE SAVINGS PLANS
Duke Energy sponsors, and the Subsidiary Registrants participate in,
employee savings plans that cover substantially all U.S. employees. Most
employees participate in a matching contribution formula where Duke Energy
provides a matching contribution generally equal to 100 percent of employee
before-tax and Roth 401(k) contributions, and, as applicable, after-tax
contributions, of up to 6 percent of eligible pay per pay period. Dividends on
Duke Energy shares held by the savings plans are charged to retained earnings
when declared and shares held in the plans are considered outstanding in the
calculation of basic and diluted earnings per share.
As of January 1, 2014, for new and rehired non-union and certain
unionized employees who are not eligible to participate in Duke Energy’s defined
benefit plans, an additional employer contribution of 4 percent of eligible pay per
pay period, which is subject to a three-year vesting schedule, is provided to the
employee’s savings plan account.