Duke Energy 2015 Annual Report Download - page 139
Download and view the complete annual report
Please find page 139 of the 2015 Duke Energy annual report below. You can navigate through the pages in the report by either clicking on the pages listed below, or by using the keyword search tool below to find specific information within the annual report.-
 1
1 -
2
-
3
-
4
-
5
-
6
-
7
-
8
-
9
-
10
-
11
-
12
-
13
-
14
-
15
-
16
-
17
-
18
-
19
-
20
-
21
-
22
-
23
-
24
-
25
-
26
-
27
-
28
-
29
-
30
-
31
-
32
-
33
-
34
-
35
-
36
-
37
-
38
-
39
-
40
-
41
-
42
-
43
-
44
-
45
-
46
-
47
-
48
-
49
-
50
-
51
-
52
-
53
-
54
-
55
-
56
-
57
-
58
-
59
-
60
-
61
-
62
-
63
-
64
-
65
-
66
-
67
-
68
-
69
-
70
-
71
-
72
-
73
-
74
-
75
-
76
-
77
-
78
-
79
-
80
-
81
-
82
-
83
-
84
-
85
-
86
-
87
-
88
-
89
-
90
-
91
-
92
-
93
-
94
-
95
-
96
-
97
-
98
-
99
-
100
-
101
-
102
-
103
-
104
-
105
-
106
-
107
-
108
-
109
-
110
-
111
-
112
-
113
-
114
-
115
-
116
-
117
-
118
-
119
-
120
-
121
-
122
-
123
-
124
-
125
-
126
-
127
-
128
-
 129
129 -
 130
130 -
 131
131 -
 132
132 -
 133
133 -
 134
134 -
 135
135 -
 136
136 -
 137
137 -
 138
138 -
 139
139 -
 140
140 -
 141
141 -
 142
142 -
 143
143 -
 144
144 -
 145
145 -
 146
146 -
 147
147 -
 148
148 -
 149
149 -
150
-
151
-
152
-
153
-
154
-
155
-
156
-
157
-
158
-
159
-
160
-
161
-
162
-
163
-
164
-
165
-
166
-
167
-
168
-
169
-
170
-
171
-
172
-
173
-
174
-
175
-
176
-
177
-
178
-
179
-
180
-
181
-
182
-
183
-
184
-
185
-
186
-
187
-
188
-
189
-
190
-
191
-
192
-
193
-
194
-
195
-
196
-
197
-
198
-
199
-
200
-
201
-
202
-
203
-
204
-
205
-
206
-
207
-
208
-
209
-
210
-
211
-
212
-
213
-
214
-
215
-
216
-
217
-
218
-
219
-
220
-
221
-
222
-
223
-
224
-
225
-
226
-
227
-
228
-
229
-
230
-
231
-
232
-
233
-
234
-
235
-
236
-
237
-
238
-
239
-
240
-
241
-
242
-
243
-
244
-
245
-
246
-
247
-
248
-
249
-
250
-
251
-
252
-
253
-
254
-
255
-
256
-
257
-
258
-
259
-
260
-
261
-
262
-
263
-
264
 |
 |

119
PART II
DUKE ENERGY CORPORATION • DUKE ENERGY CAROLINAS, LLC • PROGRESS ENERGY, INC. •
DUKE ENERGY PROGRESS, LLC • DUKE ENERGY FLORIDA, LLC • DUKE ENERGY OHIO, INC. • DUKE ENERGY INDIANA, INC.
Combined Notes to Consolidated Financial Statements – (Continued)
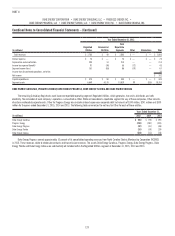
2013
Regulated Utilities $ 17,837 $ 1,720 $ 506 $ — $ 847 $ 20,910
International Energy — 1,447 — 99 — 1,546
Commercial Portfolio — 260 — — — 260
Total Reportable Segments $ 17,837 $ 3,427 $ 506 $ 99 $ 847 $ 22,716
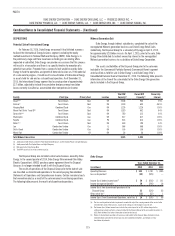
DUKE ENERGY OHIO
Duke Energy Ohio had two reportable operating segments, Regulated Utilities and Commercial Portfolio, prior to the sale of the nonregulated Midwest generation
business. As a result of the sale discussed in Note 2, Commercial Portfolio no longer qualifies as a Duke Energy Ohio reportable operating segment. Therefore,
for periods subsequent to the sale, beginning in the second quarter of 2015, all of the remaining assets and related results of operations previously presented in
Commercial Portfolio are presented in Regulated Utilities and Other.
Regulated Utilities transmits and distributes electricity in portions of Ohio and generates, distributes and sells electricity in portions of Kentucky. Regulated
Utilities also transports and sells natural gas in portions of Ohio and northern Kentucky. It conducts operations primarily through Duke Energy Ohio and its wholly
owned subsidiary, Duke Energy Kentucky.
Other is primarily comprised of governance costs allocated by its parent, Duke Energy, and revenues and expenses related to Duke Energy Ohio’s contractual
arrangement to buy power from OVEC’s power plants. For additional information on related party transactions refer to Note 9. See Note 13 for additional information.
All of Duke Energy Ohio’s revenues are generated domestically and its long-lived assets are all in the U.S.
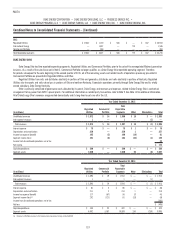
Year Ended December 31, 2015
(in millions)
Regulated
Utilities
Commercial
Portfolio
Total
Reportable
Segments Other Eliminations Total
Unaffiliated revenues $ 1,872 $ 14 $ 1,886 $ 19 $ — $ 1,905
Intersegment revenues 1 — 1 — (1) —
Total revenues $ 1,873 $ 14 $ 1,887 $ 19 $ (1) $ 1,905
Interest expense $ 78 $ — $ 78 $ 1 $ — $ 79
Depreciation and amortization 226 — 226 1 — 227
Income tax expense (benefit) 105 (5) 100 (19) — 81
Segment income (loss) 191 (8) 183 (33) (1) 149
Income from discontinued operations, net of tax 23
Net income $ 172
Capital expenditures $ 399 $ — $ 399 $ — $ — $ 399
Segment assets 7,050 — 7,050 55 (8) 7,097
Year Ended December 31, 2014
(in millions)
Regulated
Utilities
Commercial
Portfolio
Total
Reportable
Segments Other Eliminations Total
Unaffiliated revenues $ 1,894 $ 19 $ 1,913 $ — $ — $ 1,913
Intersegment revenues 1 — 1 — (1) —
Total revenues $ 1,895 $ 19 $ 1,914 $ — $ (1) $ 1,913
Interest expense $ 81 $ 5 $ 86 $ — $ — $ 86
Depreciation and amortization 211 2 213 1 — 214
Income tax expense (benefit) 117 (67) 50 (7) — 43
Segment income (loss)(a) 202 (121) 81 (13) — 68
Income from discontinued operations, net of tax (563)
Net loss $ (495)
Capital expenditures $ 300 $ 22 $ 322 $ — $ — $ 322
Segment assets 6,902 3,187 10,089 134 (230) 9,993
(a) Commercial Portfolio recorded a $94 million pretax impairment charge related to OVEC.