Duke Energy 2015 Annual Report Download - page 201
Download and view the complete annual report
Please find page 201 of the 2015 Duke Energy annual report below. You can navigate through the pages in the report by either clicking on the pages listed below, or by using the keyword search tool below to find specific information within the annual report.-
 1
1 -
2
-
3
-
4
-
5
-
6
-
7
-
8
-
9
-
10
-
11
-
12
-
13
-
14
-
15
-
16
-
17
-
18
-
19
-
20
-
21
-
22
-
23
-
24
-
25
-
26
-
27
-
28
-
29
-
30
-
31
-
32
-
33
-
34
-
35
-
36
-
37
-
38
-
39
-
40
-
41
-
42
-
43
-
44
-
45
-
46
-
47
-
48
-
49
-
50
-
51
-
52
-
53
-
54
-
55
-
56
-
57
-
58
-
59
-
60
-
61
-
62
-
63
-
64
-
65
-
66
-
67
-
68
-
69
-
70
-
71
-
72
-
73
-
74
-
75
-
76
-
77
-
78
-
79
-
80
-
81
-
82
-
83
-
84
-
85
-
86
-
87
-
88
-
89
-
90
-
91
-
92
-
93
-
94
-
95
-
96
-
97
-
98
-
99
-
100
-
101
-
102
-
103
-
104
-
105
-
106
-
107
-
108
-
109
-
110
-
111
-
112
-
113
-
114
-
115
-
116
-
117
-
118
-
119
-
120
-
121
-
122
-
123
-
124
-
125
-
126
-
127
-
128
-
129
-
130
-
131
-
132
-
133
-
134
-
135
-
136
-
137
-
138
-
139
-
140
-
141
-
142
-
143
-
144
-
145
-
146
-
147
-
148
-
149
-
150
-
151
-
152
-
153
-
154
-
155
-
156
-
157
-
158
-
159
-
160
-
161
-
162
-
163
-
164
-
165
-
166
-
167
-
168
-
169
-
170
-
171
-
172
-
173
-
174
-
175
-
176
-
177
-
178
-
179
-
180
-
181
-
182
-
183
-
184
-
185
-
186
-
187
-
188
-
189
-
190
-
 191
191 -
 192
192 -
 193
193 -
 194
194 -
 195
195 -
 196
196 -
 197
197 -
 198
198 -
 199
199 -
 200
200 -
 201
201 -
 202
202 -
 203
203 -
 204
204 -
 205
205 -
 206
206 -
 207
207 -
 208
208 -
 209
209 -
 210
210 -
 211
211 -
212
-
213
-
214
-
215
-
216
-
217
-
218
-
219
-
220
-
221
-
222
-
223
-
224
-
225
-
226
-
227
-
228
-
229
-
230
-
231
-
232
-
233
-
234
-
235
-
236
-
237
-
238
-
239
-
240
-
241
-
242
-
243
-
244
-
245
-
246
-
247
-
248
-
249
-
250
-
251
-
252
-
253
-
254
-
255
-
256
-
257
-
258
-
259
-
260
-
261
-
262
-
263
-
264
 |
 |

181
PART II
DUKE ENERGY CORPORATION • DUKE ENERGY CAROLINAS, LLC • PROGRESS ENERGY, INC. •
DUKE ENERGY PROGRESS, LLC. • DUKE ENERGY FLORIDA, LLC. • DUKE ENERGY OHIO, INC. • DUKE ENERGY INDIANA, INC.
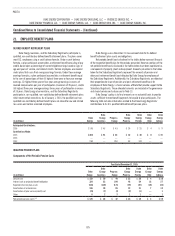
Combined Notes to Consolidated Financial Statements – (Continued)
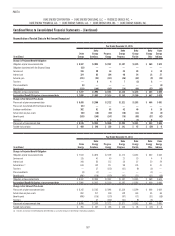
Key assumptions used in estimating fair value are detailed in the following table.
Duke Energy Ohio Duke Energy Indiana
2015 2014 2015 2014
Anticipated credit loss ratio 0.6% 0.6% 0.3% 0.3%
Discount rate 1.2% 1.2% 1.2% 1.2%
Receivable turnover rate 12.9% 12.8% 10.6% 10.5%
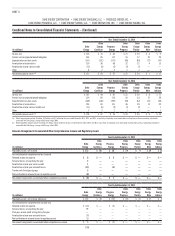
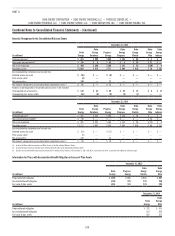
The following table shows the gross and net receivables sold.
Duke Energy Ohio Duke Energy Indiana
(in millions) 2015 2014 2015 2014
Receivables sold $ 233 $ 273 $ 260 $ 310
Less: Retained interests 47 91 60 113
Net receivables sold $ 186 $182 $ 200 $197
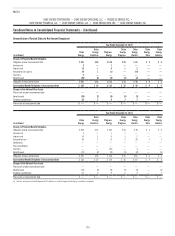
The following table shows sales and cash flows related to receivables sold.
Duke Energy Ohio Duke Energy Indiana
Years Ended December 31, Years Ended December 31,
(in millions) 2015 2014 2013 2015 2014 2013
Sales
Receivables sold $1,963 $2,246 $2,251 $2,627 $2,913 $ 2,985
Loss recognized on sale 911 12 11 11 11
Cash Flows
Cash proceeds from receivables sold 1,995 2,261 2,220 2,670 2,932 2,944
Collection fees received 11 1 11 1
Return received on retained interests 34 5 56 6
Cash flows from the sales of receivables are reflected within Cash Flows From Operating Activities on Duke Energy Ohio’s and Duke Energy Indiana’s Consolidated
Statements of Cash Flows.
Collection fees received in connection with servicing transferred accounts receivable are included in Operation, maintenance and other on Duke Energy Ohio’s
and Duke Energy Indiana’s Consolidated Statements of Operations and Comprehensive Income. The loss recognized on sales of receivables is calculated monthly by
multiplying receivables sold during the month by the required discount. The required discount is derived monthly utilizing a three-year weighted average formula that
considers charge-off history, late charge history and turnover history on the sold receivables, as well as a component for the time value of money. The discount rate, or
component for the time value of money, is the prior month-end LIBOR plus a fixed rate of 1.00 percent.
18. COMMON STOCK
Basic Earnings Per Share (EPS) is computed by dividing net income attributable to Duke Energy common stockholders, adjusted for distributed and
undistributed earnings allocated to participating securities, by the weighted average number of common stock outstanding during the period. Diluted EPS is computed
by dividing net income attributable to Duke Energy common stockholders, as adjusted for distributed and undistributed earnings allocated to participating securities,
by the diluted weighted average number of common stock outstanding during the period. Diluted EPS reflects the potential dilution that could occur if securities or
other agreements to issue common stock, such as stock options, were exercised or settled. Duke Energy’s participating securities are restricted stock units that are
entitled to dividends declared on Duke Energy common shares during the restricted stock unit’s vesting periods.