Duke Energy 2015 Annual Report Download - page 43
Download and view the complete annual report
Please find page 43 of the 2015 Duke Energy annual report below. You can navigate through the pages in the report by either clicking on the pages listed below, or by using the keyword search tool below to find specific information within the annual report.-
 1
1 -
2
-
3
-
4
-
5
-
6
-
7
-
8
-
9
-
10
-
11
-
12
-
13
-
14
-
15
-
16
-
17
-
18
-
19
-
20
-
21
-
22
-
23
-
24
-
25
-
26
-
27
-
28
-
29
-
30
-
31
-
32
-
 33
33 -
 34
34 -
 35
35 -
 36
36 -
 37
37 -
 38
38 -
 39
39 -
 40
40 -
 41
41 -
 42
42 -
 43
43 -
 44
44 -
 45
45 -
 46
46 -
 47
47 -
 48
48 -
 49
49 -
 50
50 -
 51
51 -
 52
52 -
 53
53 -
54
-
55
-
56
-
57
-
58
-
59
-
60
-
61
-
62
-
63
-
64
-
65
-
66
-
67
-
68
-
69
-
70
-
71
-
72
-
73
-
74
-
75
-
76
-
77
-
78
-
79
-
80
-
81
-
82
-
83
-
84
-
85
-
86
-
87
-
88
-
89
-
90
-
91
-
92
-
93
-
94
-
95
-
96
-
97
-
98
-
99
-
100
-
101
-
102
-
103
-
104
-
105
-
106
-
107
-
108
-
109
-
110
-
111
-
112
-
113
-
114
-
115
-
116
-
117
-
118
-
119
-
120
-
121
-
122
-
123
-
124
-
125
-
126
-
127
-
128
-
129
-
130
-
131
-
132
-
133
-
134
-
135
-
136
-
137
-
138
-
139
-
140
-
141
-
142
-
143
-
144
-
145
-
146
-
147
-
148
-
149
-
150
-
151
-
152
-
153
-
154
-
155
-
156
-
157
-
158
-
159
-
160
-
161
-
162
-
163
-
164
-
165
-
166
-
167
-
168
-
169
-
170
-
171
-
172
-
173
-
174
-
175
-
176
-
177
-
178
-
179
-
180
-
181
-
182
-
183
-
184
-
185
-
186
-
187
-
188
-
189
-
190
-
191
-
192
-
193
-
194
-
195
-
196
-
197
-
198
-
199
-
200
-
201
-
202
-
203
-
204
-
205
-
206
-
207
-
208
-
209
-
210
-
211
-
212
-
213
-
214
-
215
-
216
-
217
-
218
-
219
-
220
-
221
-
222
-
223
-
224
-
225
-
226
-
227
-
228
-
229
-
230
-
231
-
232
-
233
-
234
-
235
-
236
-
237
-
238
-
239
-
240
-
241
-
242
-
243
-
244
-
245
-
246
-
247
-
248
-
249
-
250
-
251
-
252
-
253
-
254
-
255
-
256
-
257
-
258
-
259
-
260
-
261
-
262
-
263
-
264
 |
 |

PART I
23
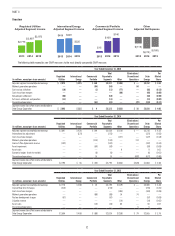
The following table provides information related to Regulated Utilities’ electric transmission and distribution properties as of December 31, 2015.
Duke
Energy
Carolinas
Duke
Energy
Progress
Duke
Energy
Florida
Duke
Energy
Ohio
Duke
Energy
Indiana
Duke
Energy
Utilities
Electric Transmission Lines
Miles of 500 to 525 Kilovolt (kV) 600 300 200 — — 1,100
Miles of 345 kV — — — 1,000 700 1,700
Miles of 230 kV 2,600 3,400 1,700 — 700 8,400
Miles of 100 to 161 kV 6,800 2,600 1,000 700 1,400 12,500
Miles of 13 to 69 kV 3,100 — 2,300 700 2,500 8,600
Total conductor miles of electric transmission lines 13,100 6,300 5,200 2,400 5,300 32,300
Electric Distribution Lines
Miles of overhead lines 66,600 44,100 24,200 13,800 22,400 171,100
Miles of underground line 36,500 23,700 18,200 5,800 8,600 92,800
Total conductor miles of electric distribution lines 103,100 67,800 42,400 19,600 31,000 263,900
Number of electric transmission and distribution substations 1,500 500 500 300 500 3,300
Miles of gas mains — — — 7,200 — 7,200
Miles of gas service lines — — — 5,800 — 5,800
Substantially all of Regulated Utilities’ electric plant in service is mortgaged under indentures relating to Duke Energy Carolinas’, Duke Energy Progress’, Duke
Energy Florida’s, Duke Energy Ohio’s and Duke Energy Indiana’s various series of First Mortgage Bonds.
INTERNATIONAL ENERGY
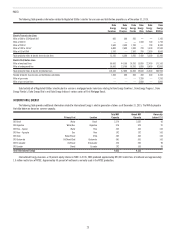
The following table provides additional information related to International Energy’s electric generation stations as of December 31, 2015. The MW displayed in
the table below are based on summer capacity.
Primary Fuel Location
Total MW
Capacity
Owned MW
Capacity
Ownership
Interest (%)
DEI Brazil Water Brazil 2,274 2,087 92
DEI Argentina Water/Gas Argentina 576 523 91
DEI Peru – Egenor Water Peru 352 352 100
DEI Peru – Aguaytia Gas Peru 192 192 100
DEI Chile Water/Diesel Chile 362 362 100
DEI Guatemala Oil/Diesel/Coal Guatemala 361 361 100
DEI El Salvador Oil/Diesel El Salvador 324 293 90
DEI Ecuador Diesel Ecuador 192 163 85
Total International Energy 4,633 4,333
International Energy also owns a 25 percent equity interest in NMC. In 2015, NMC produced approximately 890,000 metric tons of methanol and approximately
1.0 million metric tons of MTBE. Approximately 40 percent of methanol is normally used in the MTBE production.