Duke Energy 2015 Annual Report Download - page 64
Download and view the complete annual report
Please find page 64 of the 2015 Duke Energy annual report below. You can navigate through the pages in the report by either clicking on the pages listed below, or by using the keyword search tool below to find specific information within the annual report.-
 1
1 -
2
-
3
-
4
-
5
-
6
-
7
-
8
-
9
-
10
-
11
-
12
-
13
-
14
-
15
-
16
-
17
-
18
-
19
-
20
-
21
-
22
-
23
-
24
-
25
-
26
-
27
-
28
-
29
-
30
-
31
-
32
-
33
-
34
-
35
-
36
-
37
-
38
-
39
-
40
-
41
-
42
-
43
-
44
-
45
-
46
-
47
-
48
-
49
-
50
-
51
-
52
-
53
-
 54
54 -
 55
55 -
 56
56 -
 57
57 -
 58
58 -
 59
59 -
 60
60 -
 61
61 -
 62
62 -
 63
63 -
 64
64 -
 65
65 -
 66
66 -
 67
67 -
 68
68 -
 69
69 -
 70
70 -
 71
71 -
 72
72 -
 73
73 -
 74
74 -
75
-
76
-
77
-
78
-
79
-
80
-
81
-
82
-
83
-
84
-
85
-
86
-
87
-
88
-
89
-
90
-
91
-
92
-
93
-
94
-
95
-
96
-
97
-
98
-
99
-
100
-
101
-
102
-
103
-
104
-
105
-
106
-
107
-
108
-
109
-
110
-
111
-
112
-
113
-
114
-
115
-
116
-
117
-
118
-
119
-
120
-
121
-
122
-
123
-
124
-
125
-
126
-
127
-
128
-
129
-
130
-
131
-
132
-
133
-
134
-
135
-
136
-
137
-
138
-
139
-
140
-
141
-
142
-
143
-
144
-
145
-
146
-
147
-
148
-
149
-
150
-
151
-
152
-
153
-
154
-
155
-
156
-
157
-
158
-
159
-
160
-
161
-
162
-
163
-
164
-
165
-
166
-
167
-
168
-
169
-
170
-
171
-
172
-
173
-
174
-
175
-
176
-
177
-
178
-
179
-
180
-
181
-
182
-
183
-
184
-
185
-
186
-
187
-
188
-
189
-
190
-
191
-
192
-
193
-
194
-
195
-
196
-
197
-
198
-
199
-
200
-
201
-
202
-
203
-
204
-
205
-
206
-
207
-
208
-
209
-
210
-
211
-
212
-
213
-
214
-
215
-
216
-
217
-
218
-
219
-
220
-
221
-
222
-
223
-
224
-
225
-
226
-
227
-
228
-
229
-
230
-
231
-
232
-
233
-
234
-
235
-
236
-
237
-
238
-
239
-
240
-
241
-
242
-
243
-
244
-
245
-
246
-
247
-
248
-
249
-
250
-
251
-
252
-
253
-
254
-
255
-
256
-
257
-
258
-
259
-
260
-
261
-
262
-
263
-
264
 |
 |

44
PART II
Compliance with CPP could cause the industry to replace coal generation with
natural gas and renewables, especially in states that have significant CO2
reduction targets under the rule. Costs to operate coal-fired generation plants
continue to grow due to increasing environmental compliance requirements,
including ash management costs unrelated to CPP, and this may result in the
retirement of coal-fired generation plants earlier than the current useful lives.
Progress Energy continues to evaluate the need to retire generating facilities and
plans to seek regulatory recovery, where appropriate, for amounts that have not
been recovered upon asset retirements. However, recovery is subject to future
regulatory approval, including the recovery of carrying costs on remaining book
values, and therefore cannot be assured. In addition, Progress Energy could
incur increased fuel, purchased power, operation and maintenance, and other
costs for replacement generation as a result of this rule. Progress Energy cannot
predict the outcome of these matters.
DUKE ENERGY PROGRESS
Introduction
Management’s Discussion and Analysis should be read in conjunction
with the accompanying Consolidated Financial Statements and Notes for the
years ended December 31, 2015, 2014 and 2013.
Basis of Presentation
The results of operations and variance discussion for Duke Energy
Progress is presented in a reduced disclosure format in accordance with General
Instruction (I)(2)(a) of Form 10-K.
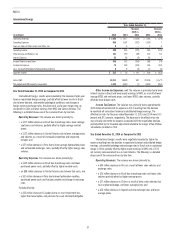
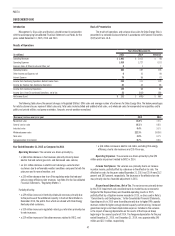
Results of Operations
Years Ended December 31,
(in millions) 2015 2014 Variance
Operating Revenues $ 5,290 $ 5,176 $ 114
Operating Expenses 4,269 4,244 25
Gains on Sales of Other Asset and Other, net 33 —
Operating Income 1,024 935 89
Other Income and Expense, net 71 51 20
Interest Expense 235 234 1
Income Before Income Taxes 860 752 108
Income Tax Expense 294 285 9
Net Income $ 566 $ 467 $ 99
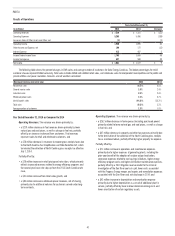
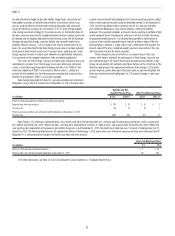
The following table shows the percent changes in GWh sales and average number of customers for Duke Energy Progress. The below percentages for retail
customer classes represent billed sales only. Total sales includes billed and unbilled retail sales, and wholesale sales to incorporated municipalities and to public and
private utilities and power marketers. Amounts are not weather normalized.
(Decrease) increase over prior year 2015 2014
Residential sales (1.4)% 5.1%
General service sales 0.9% 2.1%
Industrial sales (0.3)% (2.9)%
Wholesale power sales 13.0% (2.3)%
Joint dispatch sales 14.1% 75.3%
Total sales 3.2% 4.4%
Average number of customers 1.4% 1.1%
Year Ended December 31, 2015 as Compared to 2014
Operating Revenues. The variance was driven primarily by:
• a $100 million increase in wholesale power revenues primarily due to a
new NCEMPA contract effective August 1, 2015, and increased demand
rates charged along with higher peak demand;
• a $34 million increase in retail pricing and rate riders, which primarily
reflect increased revenues related to the energy efficiency programs
and the second year base rate step-up from the 2013 North Carolina
retail rate case; and
• a $26 million increase in fuel revenues driven primarily by increased
demand from wholesale and retail customers.
Partially offset by:
• a $44 million decrease in revenues to recover gross receipts taxes due
to the North Carolina Tax Simplification and Rate Reduction Act, which
terminated the collection of North Carolina gross receipts tax effective
July 1, 2014.