Duke Energy 2015 Annual Report Download - page 19
Download and view the complete annual report
Please find page 19 of the 2015 Duke Energy annual report below. You can navigate through the pages in the report by either clicking on the pages listed below, or by using the keyword search tool below to find specific information within the annual report.-
 1
1 -
2
-
3
-
4
-
5
-
6
-
7
-
8
-
 9
9 -
 10
10 -
 11
11 -
 12
12 -
 13
13 -
 14
14 -
 15
15 -
 16
16 -
 17
17 -
 18
18 -
 19
19 -
 20
20 -
 21
21 -
 22
22 -
 23
23 -
 24
24 -
 25
25 -
 26
26 -
 27
27 -
 28
28 -
 29
29 -
30
-
31
-
32
-
33
-
34
-
35
-
36
-
37
-
38
-
39
-
40
-
41
-
42
-
43
-
44
-
45
-
46
-
47
-
48
-
49
-
50
-
51
-
52
-
53
-
54
-
55
-
56
-
57
-
58
-
59
-
60
-
61
-
62
-
63
-
64
-
65
-
66
-
67
-
68
-
69
-
70
-
71
-
72
-
73
-
74
-
75
-
76
-
77
-
78
-
79
-
80
-
81
-
82
-
83
-
84
-
85
-
86
-
87
-
88
-
89
-
90
-
91
-
92
-
93
-
94
-
95
-
96
-
97
-
98
-
99
-
100
-
101
-
102
-
103
-
104
-
105
-
106
-
107
-
108
-
109
-
110
-
111
-
112
-
113
-
114
-
115
-
116
-
117
-
118
-
119
-
120
-
121
-
122
-
123
-
124
-
125
-
126
-
127
-
128
-
129
-
130
-
131
-
132
-
133
-
134
-
135
-
136
-
137
-
138
-
139
-
140
-
141
-
142
-
143
-
144
-
145
-
146
-
147
-
148
-
149
-
150
-
151
-
152
-
153
-
154
-
155
-
156
-
157
-
158
-
159
-
160
-
161
-
162
-
163
-
164
-
165
-
166
-
167
-
168
-
169
-
170
-
171
-
172
-
173
-
174
-
175
-
176
-
177
-
178
-
179
-
180
-
181
-
182
-
183
-
184
-
185
-
186
-
187
-
188
-
189
-
190
-
191
-
192
-
193
-
194
-
195
-
196
-
197
-
198
-
199
-
200
-
201
-
202
-
203
-
204
-
205
-
206
-
207
-
208
-
209
-
210
-
211
-
212
-
213
-
214
-
215
-
216
-
217
-
218
-
219
-
220
-
221
-
222
-
223
-
224
-
225
-
226
-
227
-
228
-
229
-
230
-
231
-
232
-
233
-
234
-
235
-
236
-
237
-
238
-
239
-
240
-
241
-
242
-
243
-
244
-
245
-
246
-
247
-
248
-
249
-
250
-
251
-
252
-
253
-
254
-
255
-
256
-
257
-
258
-
259
-
260
-
261
-
262
-
263
-
264
 |
 |

approximate 25 percent exposure to more volatile earnings business mix prior
to the Progress Energy merger based on adjusted segment income and adjusted
Other net expense for the year-to-date period ended December 31, 2011.
Adjusted segment income and adjusted Other net expense are non-GAAP
financial measures, as they represent reported segment income and Other
net expense adjusted for special items and the mark-to-market impacts of
economic hedges in the Commercial Portfolio segment (as discussed above
under Adjusted Diluted EPS). Management believes that the presentation of
adjusted segment income and adjusted Other net expense provides useful
information to investors, as it provides them an additional relevant comparison
of a segment’s or Other’s performance across periods. The most directly
comparable GAAP measure for adjusted segment income or adjusted Other net
expense is reported segment income or Other net expense, which represents
segment income and Other net expense from continuing operations, including
any special items and the mark-to-market impacts of economic hedges in
the Commercial Portfolio segment. Due to the forward-looking nature of any
forecasted adjusted segment income or adjusted Other net expense and any
related growth rates for future periods, information to reconcile these non-GAAP
financial measures to the most directly comparable GAAP financial measures
is not available at this time, as the company is unable to forecast all special
items, the mark-to-market impacts of economic hedges in the Commercial
Portfolio segment, or any amounts that may be reported as discontinued
operations for future periods.
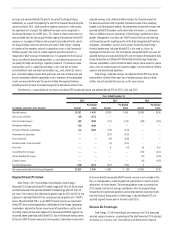
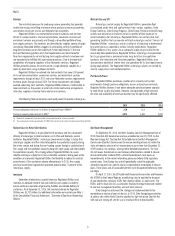
The following is a reconciliation of segment income, net income and diluted EPS to adjusted segment income, adjusted income and adjusted diluted EPS for 2011:
Year Ended December 31, 2011
(in millions, except per share amounts)
Regulated
Utilities
International
Energy
Commercial
Portfolio
Total
Reportable
Segments Other
Eliminations/
Discontinued
Operations
Duke
Energy
Per
Diluted
Share
Adjusted segment income/Adjusted Earnings $ 1,316 $ 466 $ 186 $ 1,968 $(2) $ — $1,966 $ 4.43
Midwest generation operations — — (291) (291) 8 283 — —
Edwardsport impairment (135) — — (135) — — (135) (0.30)
Costs to achieve mergers — — — — (51) — (51) (0.12)
Economic hedges (mark-to-market) — — (2) (2) — — (2) (0.01)
Discontinued operations — — — — — (72) (72) (0.17)
Segment income (loss)/Net Income Attributable to
Duke Energy Corporation $ 1,181 $ 466 $ (107) $ 1,540 (45) $ 211 $1,706 $ 3.83