Duke Energy 2015 Annual Report Download - page 229
Download and view the complete annual report
Please find page 229 of the 2015 Duke Energy annual report below. You can navigate through the pages in the report by either clicking on the pages listed below, or by using the keyword search tool below to find specific information within the annual report.-
 1
1 -
2
-
3
-
4
-
5
-
6
-
7
-
8
-
9
-
10
-
11
-
12
-
13
-
14
-
15
-
16
-
17
-
18
-
19
-
20
-
21
-
22
-
23
-
24
-
25
-
26
-
27
-
28
-
29
-
30
-
31
-
32
-
33
-
34
-
35
-
36
-
37
-
38
-
39
-
40
-
41
-
42
-
43
-
44
-
45
-
46
-
47
-
48
-
49
-
50
-
51
-
52
-
53
-
54
-
55
-
56
-
57
-
58
-
59
-
60
-
61
-
62
-
63
-
64
-
65
-
66
-
67
-
68
-
69
-
70
-
71
-
72
-
73
-
74
-
75
-
76
-
77
-
78
-
79
-
80
-
81
-
82
-
83
-
84
-
85
-
86
-
87
-
88
-
89
-
90
-
91
-
92
-
93
-
94
-
95
-
96
-
97
-
98
-
99
-
100
-
101
-
102
-
103
-
104
-
105
-
106
-
107
-
108
-
109
-
110
-
111
-
112
-
113
-
114
-
115
-
116
-
117
-
118
-
119
-
120
-
121
-
122
-
123
-
124
-
125
-
126
-
127
-
128
-
129
-
130
-
131
-
132
-
133
-
134
-
135
-
136
-
137
-
138
-
139
-
140
-
141
-
142
-
143
-
144
-
145
-
146
-
147
-
148
-
149
-
150
-
151
-
152
-
153
-
154
-
155
-
156
-
157
-
158
-
159
-
160
-
161
-
162
-
163
-
164
-
165
-
166
-
167
-
168
-
169
-
170
-
171
-
172
-
173
-
174
-
175
-
176
-
177
-
178
-
179
-
180
-
181
-
182
-
183
-
184
-
185
-
186
-
187
-
188
-
189
-
190
-
191
-
192
-
193
-
194
-
195
-
196
-
197
-
198
-
199
-
200
-
201
-
202
-
203
-
204
-
205
-
206
-
207
-
208
-
209
-
210
-
211
-
212
-
213
-
214
-
215
-
216
-
217
-
218
-
 219
219 -
 220
220 -
 221
221 -
 222
222 -
 223
223 -
 224
224 -
 225
225 -
 226
226 -
 227
227 -
 228
228 -
 229
229 -
 230
230 -
 231
231 -
 232
232 -
 233
233 -
 234
234 -
 235
235 -
 236
236 -
 237
237 -
 238
238 -
 239
239 -
240
-
241
-
242
-
243
-
244
-
245
-
246
-
247
-
248
-
249
-
250
-
251
-
252
-
253
-
254
-
255
-
256
-
257
-
258
-
259
-
260
-
261
-
262
-
263
-
264
 |
 |

209
PART II
DUKE ENERGY CORPORATION • DUKE ENERGY CAROLINAS, LLC • PROGRESS ENERGY, INC. •
DUKE ENERGY PROGRESS, LLC. • DUKE ENERGY FLORIDA, LLC. • DUKE ENERGY OHIO, INC. • DUKE ENERGY INDIANA, INC.
Combined Notes to Consolidated Financial Statements – (Continued)
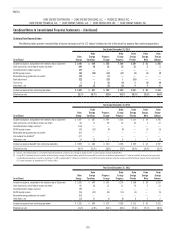
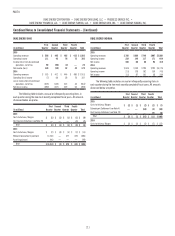
25. QUARTERLY FINANCIAL DATA (UNAUDITED)
DUKE ENERGY
Quarterly EPS amounts may not sum to the full-year total due to changes
in the weighted average number of common shares outstanding and rounding.
(in millions, except per share data)
First
Quarter
Second
Quarter
Third
Quarter
Fourth
Quarter Total
2015
Operating revenues $6,065 $5,589 $6,483 $5,322 $23,459
Operating income 1,456 1,246 1,688 977 5,367
Income from continuing operations 776 604 940 491 2,811
Income (loss) from discontinued
operations, net of tax 91 (57) (5) (9) 20
Net income 867 547 935 482 2,831
Net income attributable to Duke
Energy Corporation 864 543 932 477 2,816
Earnings per share:
Income from continuing operations
attributable to Duke Energy
Corporation common stockholders
Basic $ 1.09 $ 0.87 $ 1.36 $ 0.70 $ 4.02
Diluted $ 1.09 $ 0.87 $ 1.36 $ 0.70 $ 4.02
Income (loss) from discontinued
operations attributable to Duke
Energy Corporation common
stockholders
Basic $ 0.13 $ (0.09) $ (0.01) $ (0.01) $ 0.03
Diluted $ 0.13 $ (0.09) $ (0.01) $ (0.01) $ 0.03
Net income attributable to Duke Energy
Corporation common stockholders
Basic $ 1.22 $ 0.78 $ 1.35 $ 0.69 $ 4.05
Diluted $ 1.22 $ 0.78 $ 1.35 $ 0.69 $ 4.05
2014
Operating revenues $6,263 $5,708 $6,395 $5,559 $23,925
Operating income 1,362 1,289 1,619 988 5,258
Income from continuing operations 750 726 891 98 2,465
(Loss) Income from discontinued
operations, net of tax (843) (113) 378 2 (576)
Net (loss) income (93) 613 1,269 100 1,889
Net (loss) income attributable to Duke
Energy Corporation (97) 609 1,274 97 1,883
Earnings per share:
Income from continuing operations
attributable to Duke Energy
Corporation common stockholders
Basic $ 1.05 $ 1.02 $ 1.25 $ 0.14 $ 3.46
Diluted $ 1.05 $ 1.02 $ 1.25 $ 0.14 $ 3.46
(Loss) Income from discontinued
operations attributable to Duke
Energy Corporation common
stockholders
Basic $ (1.19) $ (0.16) $ 0.55 $ — $ (0.80)
Diluted $ (1.19) $ (0.16) $ 0.55 $ — $ (0.80)
Net (loss) income attributable to
Duke Energy Corporation common
stockholders
Basic $ (0.14) $ 0.86 $ 1.80 $ 0.14 $ 2.66
Diluted $ (0.14) $ 0.86 $ 1.80 $ 0.14 $ 2.66
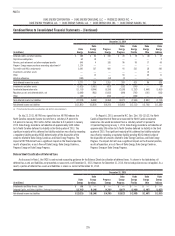
The following table includes unusual or infrequently occurring items in
each quarter during the two most recently completed fiscal years. All amounts
discussed below are pretax.
(in millions)
First
Quarter
Second
Quarter
Third
Quarter
Fourth
Quarter Total
2015
Costs to Achieve, Mergers $ (21) $ (22) $ (24) $ (30) $ (97)
Edwardsport Settlement (see Note 4) — — (90) (3) (93)
Ash Basin Settlement and Penalties
(see Note 5) — — (7) (7) (14)
State Tax Adjustment related to Midwest
Generation Sale — (41) — — (41)
Cost Savings Initiatives (see Note 19) — — — (142) (142)
Total $ (21) $ (63) $ (121) $ (182) $ (387)
2014
Costs to Achieve, Mergers $ (55) $ (61) $ (56) $ (33) $ (205)
Midwest Generation Impairment (1,287) — 477 (39) (849)
Coal Ash Plea Agreements Reserve
(see Note 5) — — — (102) (102)
International Tax Adjustment
(see Note 22) — — — (373) (373)
Asset Impairment (94) — — — (94)
Total $(1,436) $ (61) $ 421 $ (547) $(1,623)
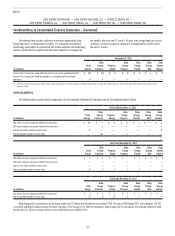
DUKE ENERGY CAROLINAS
(in millions)
First
Quarter
Second
Quarter
Third
Quarter
Fourth
Quarter Total
2015
Operating revenues $1,901 $1,707 $2,061 $1,560 $7,229
Operating income 515 483 666 296 1,960
Net income 292 265 383 141 1,081
2014
Operating revenues $2,000 $1,755 $1,938 $1,658 $7,351
Operating income 509 438 630 318 1,895
Net income 286 270 377 139 1,072
The following table includes unusual or infrequently occurring items in
each quarter during the two most recently completed fiscal years. All amounts
discussed below are pretax.
(in millions)
First
Quarter
Second
Quarter
Third
Quarter
Fourth
Quarter Total
2015
Costs to Achieve, Mergers $ (9) $ (11) $ (11) $ (16) $ (47)
Ash Basin Settlement and Penalties
(see Note 5) — — (1) (7) (8)
Cost Savings Initiatives (see Note 19) — — — (93) (93)
Total $ (9) $ (11) $ (12) $ (116) $ (148)
2014
Costs to Achieve, Mergers $ (29) $ (38) $ (25) $ (17) $ (109)
Coal Ash Plea Agreements Reserve
(see Note 5) — — — (72) (72)
Total $ (29) $ (38) $ (25) $ (89) $ (181)