Duke Energy 2015 Annual Report Download - page 53
Download and view the complete annual report
Please find page 53 of the 2015 Duke Energy annual report below. You can navigate through the pages in the report by either clicking on the pages listed below, or by using the keyword search tool below to find specific information within the annual report.-
 1
1 -
2
-
3
-
4
-
5
-
6
-
7
-
8
-
9
-
10
-
11
-
12
-
13
-
14
-
15
-
16
-
17
-
18
-
19
-
20
-
21
-
22
-
23
-
24
-
25
-
26
-
27
-
28
-
29
-
30
-
31
-
32
-
33
-
34
-
35
-
36
-
37
-
38
-
39
-
40
-
41
-
42
-
 43
43 -
 44
44 -
 45
45 -
 46
46 -
 47
47 -
 48
48 -
 49
49 -
 50
50 -
 51
51 -
 52
52 -
 53
53 -
 54
54 -
 55
55 -
 56
56 -
 57
57 -
 58
58 -
 59
59 -
 60
60 -
 61
61 -
 62
62 -
 63
63 -
64
-
65
-
66
-
67
-
68
-
69
-
70
-
71
-
72
-
73
-
74
-
75
-
76
-
77
-
78
-
79
-
80
-
81
-
82
-
83
-
84
-
85
-
86
-
87
-
88
-
89
-
90
-
91
-
92
-
93
-
94
-
95
-
96
-
97
-
98
-
99
-
100
-
101
-
102
-
103
-
104
-
105
-
106
-
107
-
108
-
109
-
110
-
111
-
112
-
113
-
114
-
115
-
116
-
117
-
118
-
119
-
120
-
121
-
122
-
123
-
124
-
125
-
126
-
127
-
128
-
129
-
130
-
131
-
132
-
133
-
134
-
135
-
136
-
137
-
138
-
139
-
140
-
141
-
142
-
143
-
144
-
145
-
146
-
147
-
148
-
149
-
150
-
151
-
152
-
153
-
154
-
155
-
156
-
157
-
158
-
159
-
160
-
161
-
162
-
163
-
164
-
165
-
166
-
167
-
168
-
169
-
170
-
171
-
172
-
173
-
174
-
175
-
176
-
177
-
178
-
179
-
180
-
181
-
182
-
183
-
184
-
185
-
186
-
187
-
188
-
189
-
190
-
191
-
192
-
193
-
194
-
195
-
196
-
197
-
198
-
199
-
200
-
201
-
202
-
203
-
204
-
205
-
206
-
207
-
208
-
209
-
210
-
211
-
212
-
213
-
214
-
215
-
216
-
217
-
218
-
219
-
220
-
221
-
222
-
223
-
224
-
225
-
226
-
227
-
228
-
229
-
230
-
231
-
232
-
233
-
234
-
235
-
236
-
237
-
238
-
239
-
240
-
241
-
242
-
243
-
244
-
245
-
246
-
247
-
248
-
249
-
250
-
251
-
252
-
253
-
254
-
255
-
256
-
257
-
258
-
259
-
260
-
261
-
262
-
263
-
264
 |
 |

33
PART II
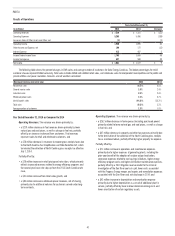
The variance in adjusted earnings for the year ended December 31, 2015,
compared to 2014, was primarily due to:
• Lower results in Latin America primarily due to lower demand,
unfavorable hydrology in Brazil, changes in foreign currency exchange
rates, a prior-year tax benefit related to the reorganization of Chilean
operations, and lower dispatch in Central America due to increased
competition;
• Higher operations and maintenance expense primarily due to the
prior-year benefit associated with the adoption of nuclear outage
levelization, amounts related to additional ownership interest in assets
acquired from NCEMPA, and higher planned fossil generation outage
costs, partially offset by lower storm restoration costs;
• Higher depreciation and amortization expense primarily due to higher
depreciable base; and
• Lower equity in earnings of unconsolidated affiliates due to lower
margins at NMC, largely driven by lower MTBE prices, partially offset by
lower butane costs.
Partially offset by:
• Increased retail pricing primarily due to rate riders in most jurisdictions,
including increased revenues related to energy efficiency programs,
equity returns related to additional ownership interest in assets
acquired from NCEMPA, and higher base rates;
• Increased wholesale net margins largely due to increases in contracted
amounts and prices and a new wholesale contract with NCEMPA;
• Retail sales growth of 0.6 percent;
• Higher results at the nonregulated Midwest generation business prior to
its sale on April 2, 2015, due to higher PJM Interconnection LLC (PJM)
capacity revenues and increased generation margins; and
• Reduction in shares outstanding due to the Duke Energy stock
repurchase (only impacts per diluted share amounts in the tables
above).
The variance in adjusted earnings for the year ended December 31, 2014,
compared to 2013, was primarily due to:
• Increased retail pricing and riders primarily resulting from the
implementation of revised rates in most jurisdictions;
• Favorable weather in 2014 compared to 2013;
• Higher PJM capacity revenues for the nonregulated Midwest generation
business due to higher prices; and
• Higher results of the renewables business due to higher production from
the wind and solar portfolios, lower costs and additional renewables
investments.
Partially offset by:
• Higher depreciation and amortization expense primarily due to higher
depreciable asset base and lower reductions to cost of removal
reserves;
• Higher operations and maintenance expense due to higher storm costs,
the timing of fossil plant outages and the impact of nuclear outage cost
levelization;
• Lower post in-service debt returns due to projects added to customer
rates; and
• Higher property and other non-income taxes.