Duke Energy 2015 Annual Report Download - page 63
Download and view the complete annual report
Please find page 63 of the 2015 Duke Energy annual report below. You can navigate through the pages in the report by either clicking on the pages listed below, or by using the keyword search tool below to find specific information within the annual report.-
 1
1 -
2
-
3
-
4
-
5
-
6
-
7
-
8
-
9
-
10
-
11
-
12
-
13
-
14
-
15
-
16
-
17
-
18
-
19
-
20
-
21
-
22
-
23
-
24
-
25
-
26
-
27
-
28
-
29
-
30
-
31
-
32
-
33
-
34
-
35
-
36
-
37
-
38
-
39
-
40
-
41
-
42
-
43
-
44
-
45
-
46
-
47
-
48
-
49
-
50
-
51
-
52
-
 53
53 -
 54
54 -
 55
55 -
 56
56 -
 57
57 -
 58
58 -
 59
59 -
 60
60 -
 61
61 -
 62
62 -
 63
63 -
 64
64 -
 65
65 -
 66
66 -
 67
67 -
 68
68 -
 69
69 -
 70
70 -
 71
71 -
 72
72 -
 73
73 -
74
-
75
-
76
-
77
-
78
-
79
-
80
-
81
-
82
-
83
-
84
-
85
-
86
-
87
-
88
-
89
-
90
-
91
-
92
-
93
-
94
-
95
-
96
-
97
-
98
-
99
-
100
-
101
-
102
-
103
-
104
-
105
-
106
-
107
-
108
-
109
-
110
-
111
-
112
-
113
-
114
-
115
-
116
-
117
-
118
-
119
-
120
-
121
-
122
-
123
-
124
-
125
-
126
-
127
-
128
-
129
-
130
-
131
-
132
-
133
-
134
-
135
-
136
-
137
-
138
-
139
-
140
-
141
-
142
-
143
-
144
-
145
-
146
-
147
-
148
-
149
-
150
-
151
-
152
-
153
-
154
-
155
-
156
-
157
-
158
-
159
-
160
-
161
-
162
-
163
-
164
-
165
-
166
-
167
-
168
-
169
-
170
-
171
-
172
-
173
-
174
-
175
-
176
-
177
-
178
-
179
-
180
-
181
-
182
-
183
-
184
-
185
-
186
-
187
-
188
-
189
-
190
-
191
-
192
-
193
-
194
-
195
-
196
-
197
-
198
-
199
-
200
-
201
-
202
-
203
-
204
-
205
-
206
-
207
-
208
-
209
-
210
-
211
-
212
-
213
-
214
-
215
-
216
-
217
-
218
-
219
-
220
-
221
-
222
-
223
-
224
-
225
-
226
-
227
-
228
-
229
-
230
-
231
-
232
-
233
-
234
-
235
-
236
-
237
-
238
-
239
-
240
-
241
-
242
-
243
-
244
-
245
-
246
-
247
-
248
-
249
-
250
-
251
-
252
-
253
-
254
-
255
-
256
-
257
-
258
-
259
-
260
-
261
-
262
-
263
-
264
 |
 |

43
PART II
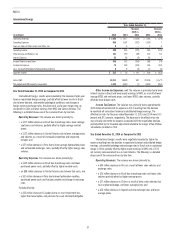
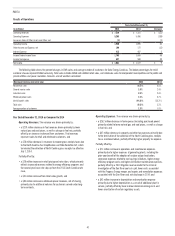
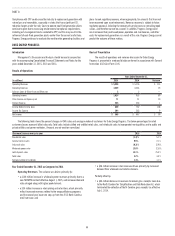
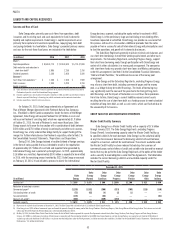
Year Ended December 31, 2015 as Compared to 2014
Operating Revenues. The variance was driven primarily by:
• a $118 million increase in wholesale power revenues primarily due
to a new NCEMPA contract effective August 1, 2015, coupled with
increased overall demand rates and higher peak demand at Duke
Energy Progress; and
• an $82 million increase in fuel revenues driven primarily by increased
demand at Duke Energy Progress and Duke Energy Florida. Fuel
revenues represent sales to retail and wholesale customers.
Partially offset by:
• a $113 decrease in rider revenues primarily due to a decrease in
the nuclear cost recovery clause as a result of suspending Levy
recovery, a decrease in energy conservation cost recovery clause and
environmental cost recovery clause revenues due to lower recovery
rates at Duke Energy Florida, partially offset by higher retail pricing and
rate riders at Duke Energy Progress, which primarily reflect increased
revenues related to the energy efficiency programs and the second year
base rate step-up from the 2013 North Carolina retail rate case.
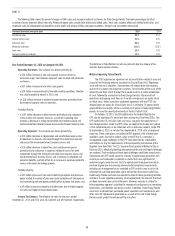
Operating Expenses. The variance was driven primarily by:
• a $29 million increase in fuel used in electric generation and purchased
power primarily due to recovery of prior year under-collections of fuel
and increased purchased power, partially offset by lower fuel prices at
Duke Energy Florida; and
• a $28 million increase in impairment charges primarily driven by a
2014 reversal of a prior-year impairment at Duke Energy Progress and
current year impairments at Duke Energy Florida.
Partially offset by:
• a $37 million decrease in operations and maintenance expenses.
For Duke Energy Progress, this was primarily due to a 2014 litigation
reserve related to the criminal investigation of the management of North
Carolina coal ash basins, lower storm restoration costs and a favorable
pension expense adjustment recorded in 2015, partially offset by higher
nuclear refueling outage expenses, including the prior-year benefit
of the adoption of nuclear outage levelization, due to three refueling
outages in 2015 compared to one outage during the same period in
2014, higher nuclear costs related to additional ownership interest in
assets acquired from NCEMPA, and severance expenses related to cost
savings initiatives. For Duke Energy Florida, this was primarily due to
a decrease in expenses related to costs that were recoverable through
the energy conservation cost recovery clause and environmental cost
recovery clause; a decrease in employee and executive benefits;
partially offset by an increase in expenses related to various information
technology projects;
• a $25 million decrease in property and other taxes primarily due to
the North Carolina Tax Simplification and Rate Reduction Act, which
terminated the collection of North Carolina gross receipts tax effective
July 1, 2014, at Duke Energy Progress, partially offset by higher property
tax rates and higher revenue related taxes at Duke Energy Florida; and
• a $12 million decrease in depreciation and amortization expenses
primarily due to reductions in amounts recovered through the nuclear
cost recovery clause and the environmental cost recovery clauses at
Duke Energy Florida, partially offset by higher depreciation related to
additional plant in service at Duke Energy Progress.
Gains on Sales of Other Assets and Other, net. The variance was
primarily due to the gain on sale of telecommunication leases.
Other Income and Expenses, net. The variance is due to higher AFUDC
equity, primarily due to nuclear plant expenditures at Duke Energy Progress.
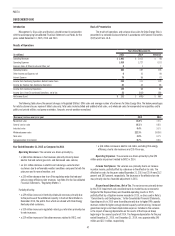
Income Tax Expense. The variance was primarily due to a lower effective
tax rate. The effective tax rates for the years ended December 31, 2015 and
2014 were 32.9 percent and 38.0 percent, respectively. The decrease in the
effective tax rate was primarily due to the non-deductible litigation reserve
related to the criminal investigation of the management of the coal ash basins
in 2014, an increase in AFUDC equity in 2015, state tax benefits from corporate
restructuring in 2015, and the release of tax reserves in 2015 due to expired
statutes.
Matters Impacting Future Results
Progress Energy is a party to multiple lawsuits and subject to fines and
other penalties related to operations at certain North Carolina facilities with
ash basins. The outcome of these lawsuits, fines and penalties could have an
adverse impact on Progress Energy’s financial position, results of operations
and cash flows. See Note 5 to the Consolidated Financial Statements,
“Commitments and Contingencies,” for additional information.
An order from regulatory authorities disallowing recovery of costs related
to closure of ash impoundments could have an adverse impact on Progress
Energy’s financial position, results of operations and cash flows. See Notes
4 and 9 to the Consolidated Financial Statements, “Regulatory Matters” and
“Asset Retirement Obligations,” respectively, for additional information.
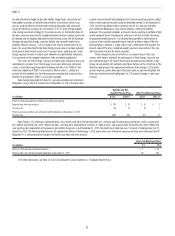
The FPSC approved an agreement on all securitization-related issues and
issued a final financing order to securitize the Crystal River Unit 3 Regulatory
asset with low-cost securities. Securitization will replace base rate recovery
and result in a lower rate impact to customers. Securitization of the costs of the
retired Crystal River Unit 3 Nuclear Plant would result in an initial acceleration
of cash, followed by a reduction to Progress Energy’s future results of operations
and ongoing cash flows as it would no longer earn an equity return on these
costs. Under a previous settlement agreement with the FPSC, the allowed
return on equity for Crystal River Unit 3 is limited to 70 percent of the approved
return on equity, which is currently 10.5 percent. Progress Energy expects the
securitization bonds to be issued in the first half of 2016.
On October 23, 2015, the EPA published in the Federal Register the
CPP rule for regulating CO2 emissions from existing fossil fuel-fired EGUs. The
CPP establishes CO2 emission rates and mass cap goals that apply to fossil
fuel-fired generation. Under the CPP, states are required to develop and submit
a final compliance plan, or an initial plan with an extension request, to the EPA
by September 6, 2016, or no later than September 6, 2018, with an approved
extension. These state plans are subject to EPA approval, with a federal plan
applied to states that fail to submit a plan to the EPA or if a state plan is
not approved. Legal challenges to the CPP have been filed by stakeholders
and motions to stay the requirements of the rule pending the outcome of the
litigation have been filed. The U.S. Supreme Court granted a Motion to Stay in
February 2016, effectively blocking enforcement of the rule until legal challenges
are resolved. Final resolution of these legal challenges could take several years.