Duke Energy 2015 Annual Report Download - page 57
Download and view the complete annual report
Please find page 57 of the 2015 Duke Energy annual report below. You can navigate through the pages in the report by either clicking on the pages listed below, or by using the keyword search tool below to find specific information within the annual report.
37
PART II
International Energy
(in millions)
Years Ended December 31,
2015 2014
Variance
2015 vs.
2014 2013
Variance
2014 vs.
2013
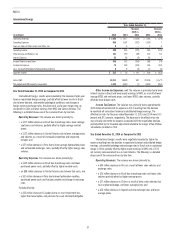
Operating Revenues $ 1,088 $ 1,417 $ (329) $ 1,546 $ (129)
Operating Expenses 805 1,007 (202) 1,000 7
Gains on Sales of Other Assets and Other, net 66 — 3 3
Operating Income 289 416 (127) 549 (133)
Other Income and Expense, net 101 190 (89) 125 65
Interest Expense 85 93 (8) 86 7
Income Before Income Taxes 305 513 (208) 588 (75)
Income Tax Expense 74 449 (375) 166 283
Less: Income Attributable to Noncontrolling Interests 69 (3) 14 (5)
Segment Income $ 225 $ 55 $ 170 $ 408 $ (353)
Sales, GWh 19,211 18,629 582 20,306 (1,677)
Net proportional MW capacity in operation 4,333 4,340 (7) 4,600 (260)
Year Ended December 31, 2015 as Compared to 2014
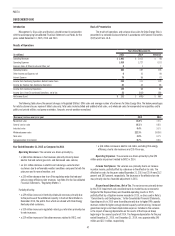
International Energy’s results were impacted by the absence of prior-year
taxes on repatriated foreign earnings, partially offset by lower results in Brazil
due to lower demand, unfavorable hydrological conditions and changes in
foreign currency exchange rates, the absence of a prior year merger step-up
tax benefit in Chile and lower earnings from NMC and Central America. The
following is a detailed discussion of the variance drivers by line item.
Operating Revenues. The variance was driven primarily by:
• a $177 million decrease in Brazil due to exchange rates, lower average
spot prices and volumes, partially offset by higher average contract
prices;
• a $122 million decrease in Central America due to lower average prices
and volumes as a result of increased competition and unplanned
outages; and
• a $27 million decrease in Peru due to lower average hydrocarbon prices
and unfavorable exchanges rates, partially offset by higher energy sales
volumes.
Operating Expenses. The variance was driven primarily by:
• a $105 million decrease in Brazil due to exchange rates and lower
purchased power costs, partially offset by higher variable costs;
• an $88 million decrease in Central America due to lower fuel costs; and
• a $31 million decrease in Peru due to lower hydrocarbon royalties,
purchased power costs and fuel consumption and change in exchange
rates.
Partially offset by:
• a $25 million increase in Ecuador due to an asset impairment loss,
higher fuel consumption, and provision for asset retirement obligation.
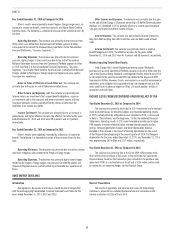
Other Income and Expenses, net. The variance is primarily due to lower
interest income in Brazil and lower equity earnings in NMC, as a result of lower
average MTBE and methanol prices, and lower MTBE sales volumes, partially
offset by lower butane costs.
Income Tax Expense. The variance was primarily due to approximately
$373 million of incremental tax expense in 2014 resulting from the decision
to repatriate all cumulative historical undistributed foreign earnings. The
effective tax rates for the years ended December 31, 2015 and 2014 were 24.3
percent and 87.3 percent, respectively. The decrease in the effective tax rate
was primarily due to the tax expense associated with the repatriation decision,
partially offset by the favorable adjustment related to the merger of two Chilean
subsidiaries recorded in 2014.
Year Ended December 31, 2014 as Compared to 2013
International Energy’s results were negatively impacted by higher tax
expense resulting from the decision to repatriate historical undistributed foreign
earnings, unfavorable hydrology and exchange rates in Brazil and an unplanned
outage in Chile, partially offset by higher equity earnings in NMC and a 2013
net currency remeasurement loss in Latin America. The following is a detailed
discussion of the variance drivers by line item.
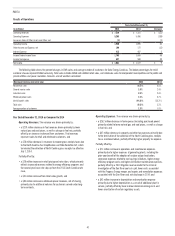
Operating Revenues. The variance was driven primarily by:
• a $44 million decrease in Peru as a result of lower sales volumes and
exchange rates;
• a $35 million decrease in Brazil due to exchange rates and lower sales
volumes partially offset by higher average prices;
• a $27 million decrease in Chile as a result of lower sales volumes due
to an unplanned outage, and lower average prices; and
• a $25 million decrease in Argentina due to exchange rates and lower
average prices.


