Duke Energy 2015 Annual Report Download - page 52
Download and view the complete annual report
Please find page 52 of the 2015 Duke Energy annual report below. You can navigate through the pages in the report by either clicking on the pages listed below, or by using the keyword search tool below to find specific information within the annual report.-
 1
1 -
2
-
3
-
4
-
5
-
6
-
7
-
8
-
9
-
10
-
11
-
12
-
13
-
14
-
15
-
16
-
17
-
18
-
19
-
20
-
21
-
22
-
23
-
24
-
25
-
26
-
27
-
28
-
29
-
30
-
31
-
32
-
33
-
34
-
35
-
36
-
37
-
38
-
39
-
40
-
41
-
 42
42 -
 43
43 -
 44
44 -
 45
45 -
 46
46 -
 47
47 -
 48
48 -
 49
49 -
 50
50 -
 51
51 -
 52
52 -
 53
53 -
 54
54 -
 55
55 -
 56
56 -
 57
57 -
 58
58 -
 59
59 -
 60
60 -
 61
61 -
 62
62 -
63
-
64
-
65
-
66
-
67
-
68
-
69
-
70
-
71
-
72
-
73
-
74
-
75
-
76
-
77
-
78
-
79
-
80
-
81
-
82
-
83
-
84
-
85
-
86
-
87
-
88
-
89
-
90
-
91
-
92
-
93
-
94
-
95
-
96
-
97
-
98
-
99
-
100
-
101
-
102
-
103
-
104
-
105
-
106
-
107
-
108
-
109
-
110
-
111
-
112
-
113
-
114
-
115
-
116
-
117
-
118
-
119
-
120
-
121
-
122
-
123
-
124
-
125
-
126
-
127
-
128
-
129
-
130
-
131
-
132
-
133
-
134
-
135
-
136
-
137
-
138
-
139
-
140
-
141
-
142
-
143
-
144
-
145
-
146
-
147
-
148
-
149
-
150
-
151
-
152
-
153
-
154
-
155
-
156
-
157
-
158
-
159
-
160
-
161
-
162
-
163
-
164
-
165
-
166
-
167
-
168
-
169
-
170
-
171
-
172
-
173
-
174
-
175
-
176
-
177
-
178
-
179
-
180
-
181
-
182
-
183
-
184
-
185
-
186
-
187
-
188
-
189
-
190
-
191
-
192
-
193
-
194
-
195
-
196
-
197
-
198
-
199
-
200
-
201
-
202
-
203
-
204
-
205
-
206
-
207
-
208
-
209
-
210
-
211
-
212
-
213
-
214
-
215
-
216
-
217
-
218
-
219
-
220
-
221
-
222
-
223
-
224
-
225
-
226
-
227
-
228
-
229
-
230
-
231
-
232
-
233
-
234
-
235
-
236
-
237
-
238
-
239
-
240
-
241
-
242
-
243
-
244
-
245
-
246
-
247
-
248
-
249
-
250
-
251
-
252
-
253
-
254
-
255
-
256
-
257
-
258
-
259
-
260
-
261
-
262
-
263
-
264
 |
 |

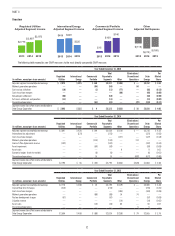
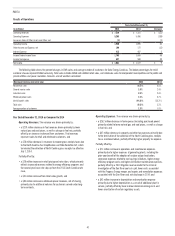
32
PART II
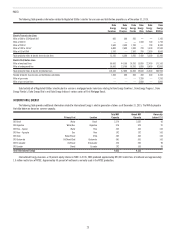
Overview
2013
$2,776
$2,897 $2,972 $408 $428
$225
$15
$109
$140
$(119)
$(216) $(185)
2014
Regulated Utilities
Adjusted Segment Income
International Energy
Adjusted Segment Income
Commercial Portfolio
Adjusted Segment Income
Other
Adjusted Net Expense
2015 2013 2014 2015 2013 2014 2015 2013 2014 2015
The following table reconciles non-GAAP measures to the most directly comparable GAAP measure.
Year Ended December 31, 2015
(in millions, except per share amounts)
Regulated
Utilities
International
Energy
Commercial
Portfolio
Total
Reportable
Segments Other
Eliminations/
Discontinued
Operations
Duke
Energy
Per
Diluted
Share
Adjusted segment income/Adjusted earnings $ 2,972 $ 225 $ 140 $3,337 $(185) $ — $3,152 $ 4.54
Midwest generation operations — — (94) (94) — 94 — —
Cost savings initiatives (10) — (1) (11) (77) — (88) (0.13)
Costs to achieve mergers — — — — (60) — (60) (0.09)
Edwardsport settlement (58) — — (58) — — (58) (0.08)
Ash basin settlement and penalties (11) — — (11) — — (11) (0.02)
Discontinued operations — — (41) (41) — (78) (119) (0.17)
Segment income (loss)/Net income attributable to
Duke Energy Corporation $ 2,893 $ 225 $ 4 $3,122 $(322) $ 16 $2,816 $ 4.05
Year Ended December 31, 2014
(in millions, except per share amounts)
Regulated
Utilities
International
Energy
Commercial
Portfolio
Total
Reportable
Segments Other
Eliminations/
Discontinued
Operations
Duke
Energy
Per
Diluted
Share
Adjusted segment income/Adjusted earnings $2,897 $ 428 $ 109 $3,434 $(216) $ — $3,218 $ 4.55
International tax adjustment — (373) — (373) — — (373) (0.53)
Costs to achieve mergers — — — — (127) — (127) (0.18)
Midwest generation operations — — (114) (114) — 114 — —
Coal ash Plea Agreements reserve (102) — — (102) — — (102) (0.14)
Asset impairment ——(59) (59) — — (59) (0.08)
Asset sales — —— — 9 — 9 0.01
Economic hedges (mark-to-market) — — (6) (6) — — (6) (0.01)
Discontinued operations — — 15 15 — (692) (677) (0.96)
Segment income (loss)/Net income attributable to
Duke Energy Corporation $2,795 $ 55 $ (55) $2,795 $(334) $(578) $1,883 $ 2.66
Year Ended December 31, 2013
(in millions, except per share amounts)
Regulated
Utilities
International
Energy
Commercial
Portfolio
Total
Reportable
Segments Other
Eliminations/
Discontinued
Operations
Duke
Energy
Per
Diluted
Share
Adjusted segment income/Adjusted earnings $2,776 $ 408 $ 15 $3,199 $(119) $ — $3,080 $ 4.36
Crystal River Unit 3 charges (215) — — (215) — — (215) (0.31)
Costs to achieve mergers — — — — (184) — (184) (0.26)
Midwest generation operations — — (88) (88) 14 74 — —
Nuclear development charges (57) — — (57) — — (57) (0.08)
Litigation reserve — —— — (14) — (14) (0.02)
Asset sales — — (15) (15) 65 — 50 0.07
Discontinued operations — — — — — 5 5 —
Segment income (loss)/Net income attributable to
Duke Energy Corporation $2,504 $ 408 $ (88) $2,824 $(238) $ 79 $2,665 $ 3.76