Duke Energy 2015 Annual Report Download - page 224
Download and view the complete annual report
Please find page 224 of the 2015 Duke Energy annual report below. You can navigate through the pages in the report by either clicking on the pages listed below, or by using the keyword search tool below to find specific information within the annual report.-
 1
1 -
2
-
3
-
4
-
5
-
6
-
7
-
8
-
9
-
10
-
11
-
12
-
13
-
14
-
15
-
16
-
17
-
18
-
19
-
20
-
21
-
22
-
23
-
24
-
25
-
26
-
27
-
28
-
29
-
30
-
31
-
32
-
33
-
34
-
35
-
36
-
37
-
38
-
39
-
40
-
41
-
42
-
43
-
44
-
45
-
46
-
47
-
48
-
49
-
50
-
51
-
52
-
53
-
54
-
55
-
56
-
57
-
58
-
59
-
60
-
61
-
62
-
63
-
64
-
65
-
66
-
67
-
68
-
69
-
70
-
71
-
72
-
73
-
74
-
75
-
76
-
77
-
78
-
79
-
80
-
81
-
82
-
83
-
84
-
85
-
86
-
87
-
88
-
89
-
90
-
91
-
92
-
93
-
94
-
95
-
96
-
97
-
98
-
99
-
100
-
101
-
102
-
103
-
104
-
105
-
106
-
107
-
108
-
109
-
110
-
111
-
112
-
113
-
114
-
115
-
116
-
117
-
118
-
119
-
120
-
121
-
122
-
123
-
124
-
125
-
126
-
127
-
128
-
129
-
130
-
131
-
132
-
133
-
134
-
135
-
136
-
137
-
138
-
139
-
140
-
141
-
142
-
143
-
144
-
145
-
146
-
147
-
148
-
149
-
150
-
151
-
152
-
153
-
154
-
155
-
156
-
157
-
158
-
159
-
160
-
161
-
162
-
163
-
164
-
165
-
166
-
167
-
168
-
169
-
170
-
171
-
172
-
173
-
174
-
175
-
176
-
177
-
178
-
179
-
180
-
181
-
182
-
183
-
184
-
185
-
186
-
187
-
188
-
189
-
190
-
191
-
192
-
193
-
194
-
195
-
196
-
197
-
198
-
199
-
200
-
201
-
202
-
203
-
204
-
205
-
206
-
207
-
208
-
209
-
210
-
211
-
212
-
213
-
 214
214 -
 215
215 -
 216
216 -
 217
217 -
 218
218 -
 219
219 -
 220
220 -
 221
221 -
 222
222 -
 223
223 -
 224
224 -
 225
225 -
 226
226 -
 227
227 -
 228
228 -
 229
229 -
 230
230 -
 231
231 -
 232
232 -
 233
233 -
 234
234 -
235
-
236
-
237
-
238
-
239
-
240
-
241
-
242
-
243
-
244
-
245
-
246
-
247
-
248
-
249
-
250
-
251
-
252
-
253
-
254
-
255
-
256
-
257
-
258
-
259
-
260
-
261
-
262
-
263
-
264
 |
 |

204
PART II
DUKE ENERGY CORPORATION • DUKE ENERGY CAROLINAS, LLC • PROGRESS ENERGY, INC. •
DUKE ENERGY PROGRESS, LLC. • DUKE ENERGY FLORIDA, LLC. • DUKE ENERGY OHIO, INC. • DUKE ENERGY INDIANA, INC.
Combined Notes to Consolidated Financial Statements – (Continued)
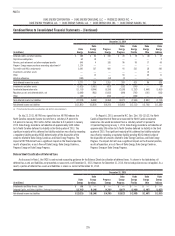
Valuation allowances have been established for certain foreign and state NOL carryforwards and state income tax credits that reduce deferred tax assets to an
amount that will be realized on a more-likely-than-not basis. The net change in the total valuation allowance is included in Tax differential on foreign earnings and
State income tax, net of federal income tax effect in the above tables.
Undistributed Foreign Earnings
As of December 31, 2015, Duke Energy’s intention was to indefinitely reinvest undistributed earnings generated by Duke Energy’s foreign subsidiaries. As a
result, no U.S. tax is recorded on such earnings of approximately $250 million. The amount of unrecognized deferred tax liability related to undistributed earnings was
approximately $12 million.
On February 18, 2016, Duke Energy announced it had initiated a process to divest the International Energy business segment, excluding the investment in NMC.
See Note 2 for further information. Accordingly, Duke Energy no longer intends to indefinitely reinvest the undistributed foreign earnings of International Energy and will
therefore record U.S. taxes related to International Energy’s undistributed foreign earnings during the first quarter of 2016.
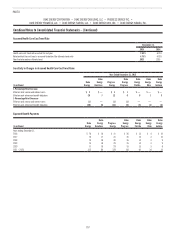
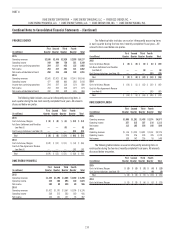
DEFERRED TAXES
Net Deferred Income Tax Liability Components
December 31, 2015
(in millions)
Duke
Energy
Duke
Energy
Carolinas
Progress
Energy
Duke
Energy
Progress
Duke
Energy
Florida
Duke
Energy
Ohio
Duke
Energy
Indiana
Deferred credits and other liabilities $ 245 $ 38 $ 115 $ 25 $ 66 $ 29 $ 5
Capital lease obligations 63 9 — — — — 2
Pension, post-retirement and other employee benefits 580 46 186 92 82 24 40
Progress Energy merger purchase accounting adjustments(a) 1,009 — — — — — —
Tax credits and NOL carryforwards 3,719 170 997 163 177 25 215
Investments and other assets — — — — — 3 —
Other 206 20 48 2 46 37 20
Valuation allowance (160) — (38) — — — —
Total deferred income tax assets 5,662 283 1,308 282 371 118 282
Investments and other assets (1,584) (1,057) (412) (228) (201) — (7)
Accelerated depreciation rates (13,070) (4,429) (4,169) (2,325) (1,868) (1,356) (1,797)
Regulatory assets and deferred debits, net (3,633) (943) (1,517) (756) (762) (169) (135)
Total deferred income tax liabilities (18,287) (6,429) (6,098) (3,309) (2,831) (1,525) (1,939)
Net deferred income tax liabilities $(12,625) $(6,146) $(4,790) $(3,027) $(2,460) $(1,407) $(1,657)
(a) Primarily related to capital lease obligations and debt fair value adjustments.
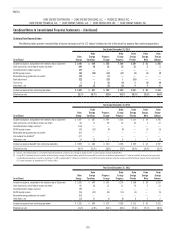
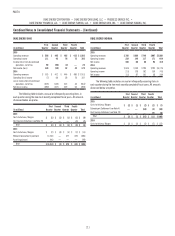
The following table presents the expiration of tax credits and NOL carryforwards.
December 31, 2015
(in millions) Amount
Expiration
Year
Investment tax credits $ 864 2029 – 2035
Alternative minimum tax credits 1,121 Indefinite
Federal NOL carryforwards 484 2030 – 2033
State NOL carryforwards and credits(a) 299 2016 – 2035
Foreign NOL carryforwards(b) 100 2026 – 2034
Foreign Tax Credits 851 2024
Total tax credits and NOL carryforwards $ 3,719
(a) A valuation allowance of $81 million has been recorded on the state Net Operating Loss carryforwards, as presented in the Net Deferred Income Tax Liability Components table.
(b) A valuation allowance of $79 million has been recorded on the foreign Net Operating Loss carryforwards, as presented in the Net Deferred Income Tax Liability Components table.