Duke Energy 2015 Annual Report Download - page 129
Download and view the complete annual report
Please find page 129 of the 2015 Duke Energy annual report below. You can navigate through the pages in the report by either clicking on the pages listed below, or by using the keyword search tool below to find specific information within the annual report.
109
PART II
DUKE ENERGY CORPORATION • DUKE ENERGY CAROLINAS, LLC • PROGRESS ENERGY, INC. •
DUKE ENERGY PROGRESS, LLC. • DUKE ENERGY FLORIDA, LLC. • DUKE ENERGY OHIO, INC. • DUKE ENERGY INDIANA, INC.
Combined Notes to Consolidated Financial Statements – (Continued)
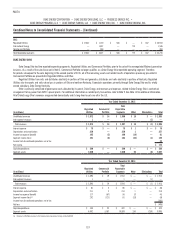
December 31, 2014
(in millions)
Duke
Energy
Duke
Energy
Carolinas
Progress
Energy
Duke
Energy
Progress
Duke
Energy
Florida
Duke
Energy
Ohio
Duke
Energy
Indiana
Materials and supplies $ 2,102 $ 719 $ 981 $ 676 $ 305 $ 67 $ 258
Coal held for electric generation 997 362 329 150 178 21 275
Oil, gas and other fuel held for electric generation 360 43 280 140 140 9 4
Total inventory $ 3,459 $ 1,124 $ 1,590 $ 966 $ 623 $ 97 $ 537
Investments in Debt and Equity Securities
The Duke Energy Registrants classify investments into two categories –
trading and available-for-sale. Both categories are recorded at fair value on
the Consolidated Balance Sheets. Realized and unrealized gains and losses
on trading securities are included in earnings. For certain investments of
regulated operations such as the Nuclear Decommissioning Trust Fund (NDTF),
realized and unrealized gains and losses (including any other-than-temporary
impairments) on available-for-sale securities are recorded as a regulatory asset
or liability. Otherwise, unrealized gains and losses are included in Accumulated
Other Comprehensive Income (AOCI), unless other-than-temporarily impaired.
Other-than-temporary impairments for equity securities and the credit loss
portion of debt securities of nonregulated operations are included in earnings.
Investments in debt and equity securities are classified as either current or
noncurrent based on management’s intent and ability to sell these securities,
taking into consideration current market liquidity. See Note 15 for further
information.
Goodwill and Intangible Assets
Goodwill
Duke Energy, Progress Energy and Duke Energy Ohio perform annual
goodwill impairment tests as of August 31 each year at the reporting unit level,
which is determined to be an operating segment or one level below. Duke Energy,
Progress Energy and Duke Energy Ohio update these tests between annual tests
if events or circumstances occur that would more likely than not reduce the fair
value of a reporting unit below its carrying value.
Intangible Assets
Intangible assets are included in Other in Investments and Other Assets
on the Consolidated Balance Sheets. Generally, intangible assets are amortized
using an amortization method that reflects the pattern in which the economic
benefits of the intangible asset are consumed, or on a straight-line basis if that
pattern is not readily determinable. Amortization of intangibles is reflected in
Depreciation and amortization on the Consolidated Statements of Operations.
Intangible assets are subject to impairment testing and if impaired, the carrying
value is accordingly reduced.
Emission allowances permit the holder of the allowance to emit certain
gaseous byproducts of fossil fuel combustion, including sulfur dioxide (SO2)
and nitrogen oxide (NOX). Allowances are issued by the U.S. Environmental
Protection Agency (EPA) at zero cost and may also be bought and sold via
third-party transactions. Allowances allocated to or acquired by the Duke Energy
Registrants are held primarily for consumption. Carrying amounts for emission
allowances are based on the cost to acquire the allowances or, in the case
of a business combination, on the fair value assigned in the allocation of the
purchase price of the acquired business. Emission allowances are expensed
to Fuel used in electric generation and purchased power – regulated on the
Consolidated Statements of Operations.
Renewable energy certificates are used to measure compliance with
renewable energy standards and are held primarily for consumption. See Note
11 for further information.
Long-Lived Asset Impairments
The Duke Energy Registrants evaluate long-lived assets, excluding
goodwill, for impairment when circumstances indicate the carrying value of
those assets may not be recoverable. An impairment exists when a long-lived
asset’s carrying value exceeds the estimated undiscounted cash flows expected
to result from the use and eventual disposition of the asset. The estimated
cash flows may be based on alternative expected outcomes that are probability
weighted. If the carrying value of the long-lived asset is not recoverable
based on these estimated future undiscounted cash flows, the carrying value
of the asset is written-down to its then-current estimated fair value and an
impairment charge is recognized.
The Duke Energy Registrants assess fair value of long-lived assets
using various methods, including recent comparable third-party sales,
internally developed discounted cash flow analysis and analysis from outside
advisers. Significant changes in commodity prices, the condition of an asset or
management’s interest in selling the asset are generally viewed as triggering
events to reassess cash flows.
Property, Plant and Equipment
Property, plant and equipment are stated at the lower of depreciated
historical cost net of any disallowances or fair value, if impaired. The Duke Energy
Registrants capitalize all construction-related direct labor and material costs,
as well as indirect construction costs such as general engineering, taxes and
financing costs. See “Allowance for Funds Used During Construction (AFUDC)
and Interest Capitalized” for information on capitalized financing costs. Costs
of renewals and betterments that extend the useful life of property, plant and
equipment are also capitalized. The cost of repairs, replacements and major
maintenance projects, which do not extend the useful life or increase the expected
output of the asset, are expensed as incurred. Depreciation is generally computed
over the estimated useful life of the asset using the composite straight-line
method. Depreciation studies are conducted periodically to update composite
rates and are approved by state utility commissions and/or the FERC when
required. The composite weighted average depreciation rates, excluding nuclear
fuel, are included in the table that follows.


