Duke Energy 2015 Annual Report Download - page 4
Download and view the complete annual report
Please find page 4 of the 2015 Duke Energy annual report below. You can navigate through the pages in the report by either clicking on the pages listed below, or by using the keyword search tool below to find specific information within the annual report.-
 1
1 -
 2
2 -
 3
3 -
 4
4 -
 5
5 -
 6
6 -
 7
7 -
 8
8 -
 9
9 -
 10
10 -
 11
11 -
 12
12 -
 13
13 -
 14
14 -
 15
15 -
16
-
17
-
18
-
19
-
20
-
21
-
22
-
23
-
24
-
25
-
26
-
27
-
28
-
29
-
30
-
31
-
32
-
33
-
34
-
35
-
36
-
37
-
38
-
39
-
40
-
41
-
42
-
43
-
44
-
45
-
46
-
47
-
48
-
49
-
50
-
51
-
52
-
53
-
54
-
55
-
56
-
57
-
58
-
59
-
60
-
61
-
62
-
63
-
64
-
65
-
66
-
67
-
68
-
69
-
70
-
71
-
72
-
73
-
74
-
75
-
76
-
77
-
78
-
79
-
80
-
81
-
82
-
83
-
84
-
85
-
86
-
87
-
88
-
89
-
90
-
91
-
92
-
93
-
94
-
95
-
96
-
97
-
98
-
99
-
100
-
101
-
102
-
103
-
104
-
105
-
106
-
107
-
108
-
109
-
110
-
111
-
112
-
113
-
114
-
115
-
116
-
117
-
118
-
119
-
120
-
121
-
122
-
123
-
124
-
125
-
126
-
127
-
128
-
129
-
130
-
131
-
132
-
133
-
134
-
135
-
136
-
137
-
138
-
139
-
140
-
141
-
142
-
143
-
144
-
145
-
146
-
147
-
148
-
149
-
150
-
151
-
152
-
153
-
154
-
155
-
156
-
157
-
158
-
159
-
160
-
161
-
162
-
163
-
164
-
165
-
166
-
167
-
168
-
169
-
170
-
171
-
172
-
173
-
174
-
175
-
176
-
177
-
178
-
179
-
180
-
181
-
182
-
183
-
184
-
185
-
186
-
187
-
188
-
189
-
190
-
191
-
192
-
193
-
194
-
195
-
196
-
197
-
198
-
199
-
200
-
201
-
202
-
203
-
204
-
205
-
206
-
207
-
208
-
209
-
210
-
211
-
212
-
213
-
214
-
215
-
216
-
217
-
218
-
219
-
220
-
221
-
222
-
223
-
224
-
225
-
226
-
227
-
228
-
229
-
230
-
231
-
232
-
233
-
234
-
235
-
236
-
237
-
238
-
239
-
240
-
241
-
242
-
243
-
244
-
245
-
246
-
247
-
248
-
249
-
250
-
251
-
252
-
253
-
254
-
255
-
256
-
257
-
258
-
259
-
260
-
261
-
262
-
263
-
264
 |
 |

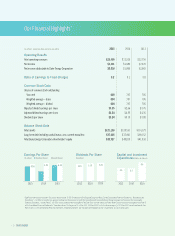
\ 2 \ DUKE ENERGY
(In millions, except per share amounts and ratios) 2015 2014 2013
Operating Results
Total operating revenues $23,459 $23,925 $22,756
Net income $2,831 $1,889 $2,676
Net income attributable to Duke Energy Corporation $2,816 $1,883 $2,665
Ratio of Earnings to Fixed Charges 3.2 3.2 3.0
Common Stock Data
Shares of common stock outstanding
Year-end 688 707 706
Weighted average – basic 694 707 706
Weighted average – diluted 694 707 706
Reported diluted earnings per share $4.05 $2.66 $3.76
Adjusted diluted earnings per share $4.54 $4.55 $4.36
Dividends per share $3.24 $3.15 $3.09
Balance Sheet Data
Total assets $121,156 $120,557 $114,779
Long-term debt including capital leases, less current maturities $37,495 $37,061 $38,152
Total Duke Energy Corporation shareholders’ equity $39,727 $40,875 $41,330
Earnings Per Share
(in dollars) Reported Diluted Adjusted Diluted
2015
4.05 4.54
2014
2.66
4.55
2013
3.76 4.36
Capital and Investment
Expenditures (dollars in billions)
2014
5.5
2013
5.6
2015
8.4
a
Signicant transactions reected in the results above include: (i) 2014 impairment of the Disposal Group (see Note 2 to the Consolidated Financial Statements, “Acquisitions and
Dispositions”); (ii) 2014 incremental tax expense resulting from the decision to repatriate cumulative historical undistributed foreign earnings (see Note 22 to the Consolidated
Financial Statements, “Income Taxes”); (iii) 2014 reserve related to the investigation of the Dan River coal ash release and other North Carolina ash basin management (see Note 5
to the Consolidated Financial Statements, “Commitments and Contingencies”); (iv) the 2015, 2014 and 2013 costs to achieve mergers; (v) 2014 and 2013 asset impairments (see
Notes 4 and 11 to the Consolidated Financial Statements, “Regulatory Matters” and “Goodwill and Intangible Assets,” respectively); and 2013 asset sales.
Dividends Per Share
(in dollars)
2014
3.15
2015
3.24
2013
3.09
Our Financial Highlightsa