Duke Energy 2015 Annual Report Download - page 192
Download and view the complete annual report
Please find page 192 of the 2015 Duke Energy annual report below. You can navigate through the pages in the report by either clicking on the pages listed below, or by using the keyword search tool below to find specific information within the annual report.-
 1
1 -
2
-
3
-
4
-
5
-
6
-
7
-
8
-
9
-
10
-
11
-
12
-
13
-
14
-
15
-
16
-
17
-
18
-
19
-
20
-
21
-
22
-
23
-
24
-
25
-
26
-
27
-
28
-
29
-
30
-
31
-
32
-
33
-
34
-
35
-
36
-
37
-
38
-
39
-
40
-
41
-
42
-
43
-
44
-
45
-
46
-
47
-
48
-
49
-
50
-
51
-
52
-
53
-
54
-
55
-
56
-
57
-
58
-
59
-
60
-
61
-
62
-
63
-
64
-
65
-
66
-
67
-
68
-
69
-
70
-
71
-
72
-
73
-
74
-
75
-
76
-
77
-
78
-
79
-
80
-
81
-
82
-
83
-
84
-
85
-
86
-
87
-
88
-
89
-
90
-
91
-
92
-
93
-
94
-
95
-
96
-
97
-
98
-
99
-
100
-
101
-
102
-
103
-
104
-
105
-
106
-
107
-
108
-
109
-
110
-
111
-
112
-
113
-
114
-
115
-
116
-
117
-
118
-
119
-
120
-
121
-
122
-
123
-
124
-
125
-
126
-
127
-
128
-
129
-
130
-
131
-
132
-
133
-
134
-
135
-
136
-
137
-
138
-
139
-
140
-
141
-
142
-
143
-
144
-
145
-
146
-
147
-
148
-
149
-
150
-
151
-
152
-
153
-
154
-
155
-
156
-
157
-
158
-
159
-
160
-
161
-
162
-
163
-
164
-
165
-
166
-
167
-
168
-
169
-
170
-
171
-
172
-
173
-
174
-
175
-
176
-
177
-
178
-
179
-
180
-
181
-
 182
182 -
 183
183 -
 184
184 -
 185
185 -
 186
186 -
 187
187 -
 188
188 -
 189
189 -
 190
190 -
 191
191 -
 192
192 -
 193
193 -
 194
194 -
 195
195 -
 196
196 -
 197
197 -
 198
198 -
 199
199 -
 200
200 -
 201
201 -
 202
202 -
203
-
204
-
205
-
206
-
207
-
208
-
209
-
210
-
211
-
212
-
213
-
214
-
215
-
216
-
217
-
218
-
219
-
220
-
221
-
222
-
223
-
224
-
225
-
226
-
227
-
228
-
229
-
230
-
231
-
232
-
233
-
234
-
235
-
236
-
237
-
238
-
239
-
240
-
241
-
242
-
243
-
244
-
245
-
246
-
247
-
248
-
249
-
250
-
251
-
252
-
253
-
254
-
255
-
256
-
257
-
258
-
259
-
260
-
261
-
262
-
263
-
264
 |
 |

172
PART II
DUKE ENERGY CORPORATION • DUKE ENERGY CAROLINAS, LLC • PROGRESS ENERGY, INC. •
DUKE ENERGY PROGRESS, LLC. • DUKE ENERGY FLORIDA, LLC. • DUKE ENERGY OHIO, INC. • DUKE ENERGY INDIANA, INC.
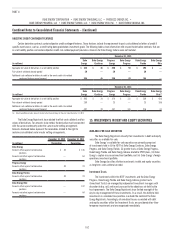
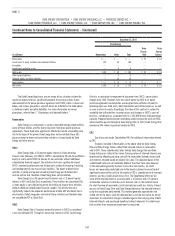
Combined Notes to Consolidated Financial Statements – (Continued)
PROGRESS ENERGY
The following tables provide recorded balances for assets and liabilities measured at fair value on a recurring basis on the Consolidated Balance Sheets.
Derivative amounts in the table below exclude cash collateral, which is disclosed in Note 14. See Note 15 for additional information related to investments by major
security type.
December 31, 2015
(in millions) Total Fair Value Level 1 Level 2 Level 3
Nuclear decommissioning trust fund equity securities $1,496 $1,496 $ — $ —
Nuclear decommissioning trust fund debt securities 1,283 426 857 —
Other available-for-sale debt securities 63 18 45 —
Derivative assets 11 — 11 —
Total assets 2,853 1,940 913 —
Derivative liabilities (322) — (322) —
Net assets $2,531 $1,940 $ 591 $ —
December 31, 2014
(in millions) Total Fair Value Level 1 Level 2 Level 3
Nuclear decommissioning trust fund equity securities $ 1,488 $ 1,488 $ — $ —
Nuclear decommissioning trust fund debt securities 1,029 510 519 —
Other trading and available-for-sale debt securities 58 15 43 —
Derivative assets 4 — 4 —
Total assets 2,579 2,013 566 —
Derivative liabilities (373) — (373) —
Net assets $ 2,206 $ 2,013 $ 193 $ —
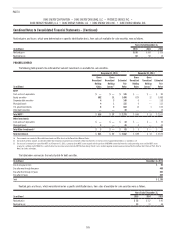
DUKE ENERGY PROGRESS
The following tables provide recorded balances for assets and liabilities measured at fair value on a recurring basis on the Consolidated Balance Sheets.
Derivative amounts in the table below exclude cash collateral which is disclosed in Note 14. See Note 15 for additional information related to investments by major
security type.
December 31, 2015
(in millions) Total Fair Value Level 1 Level 2 Level 3
Nuclear decommissioning trust fund equity securities $1,178 $1,178 $ — $ —
Nuclear decommissioning trust fund debt securities and other 860 141 719 —
Other available-for-sale debt securities and other 1 1 — —
Derivative assets 2 — 2 —
Total assets 2,041 1,320 721 —
Derivative liabilities (98) — (98) —
Net assets $1,943 $1,320 $ 623 $ —
December 31, 2014
(in millions) Total Fair Value Level 1 Level 2 Level 3
Nuclear decommissioning trust fund equity securities $ 1,171 $1,171 $ — $—
Nuclear decommissioning trust fund debt securities and other 540 151 389 —
Total assets 1,711 1,322 389 —
Derivative liabilities (132) — (132) —
Net assets $ 1,579 $1,322 $ 257 $—