Duke Energy 2015 Annual Report Download - page 55
Download and view the complete annual report
Please find page 55 of the 2015 Duke Energy annual report below. You can navigate through the pages in the report by either clicking on the pages listed below, or by using the keyword search tool below to find specific information within the annual report.-
 1
1 -
2
-
3
-
4
-
5
-
6
-
7
-
8
-
9
-
10
-
11
-
12
-
13
-
14
-
15
-
16
-
17
-
18
-
19
-
20
-
21
-
22
-
23
-
24
-
25
-
26
-
27
-
28
-
29
-
30
-
31
-
32
-
33
-
34
-
35
-
36
-
37
-
38
-
39
-
40
-
41
-
42
-
43
-
44
-
 45
45 -
 46
46 -
 47
47 -
 48
48 -
 49
49 -
 50
50 -
 51
51 -
 52
52 -
 53
53 -
 54
54 -
 55
55 -
 56
56 -
 57
57 -
 58
58 -
 59
59 -
 60
60 -
 61
61 -
 62
62 -
 63
63 -
 64
64 -
 65
65 -
66
-
67
-
68
-
69
-
70
-
71
-
72
-
73
-
74
-
75
-
76
-
77
-
78
-
79
-
80
-
81
-
82
-
83
-
84
-
85
-
86
-
87
-
88
-
89
-
90
-
91
-
92
-
93
-
94
-
95
-
96
-
97
-
98
-
99
-
100
-
101
-
102
-
103
-
104
-
105
-
106
-
107
-
108
-
109
-
110
-
111
-
112
-
113
-
114
-
115
-
116
-
117
-
118
-
119
-
120
-
121
-
122
-
123
-
124
-
125
-
126
-
127
-
128
-
129
-
130
-
131
-
132
-
133
-
134
-
135
-
136
-
137
-
138
-
139
-
140
-
141
-
142
-
143
-
144
-
145
-
146
-
147
-
148
-
149
-
150
-
151
-
152
-
153
-
154
-
155
-
156
-
157
-
158
-
159
-
160
-
161
-
162
-
163
-
164
-
165
-
166
-
167
-
168
-
169
-
170
-
171
-
172
-
173
-
174
-
175
-
176
-
177
-
178
-
179
-
180
-
181
-
182
-
183
-
184
-
185
-
186
-
187
-
188
-
189
-
190
-
191
-
192
-
193
-
194
-
195
-
196
-
197
-
198
-
199
-
200
-
201
-
202
-
203
-
204
-
205
-
206
-
207
-
208
-
209
-
210
-
211
-
212
-
213
-
214
-
215
-
216
-
217
-
218
-
219
-
220
-
221
-
222
-
223
-
224
-
225
-
226
-
227
-
228
-
229
-
230
-
231
-
232
-
233
-
234
-
235
-
236
-
237
-
238
-
239
-
240
-
241
-
242
-
243
-
244
-
245
-
246
-
247
-
248
-
249
-
250
-
251
-
252
-
253
-
254
-
255
-
256
-
257
-
258
-
259
-
260
-
261
-
262
-
263
-
264
 |
 |

35
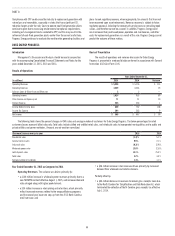
PART II
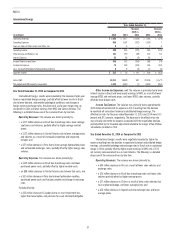
Income Tax Expense. The variance was primarily due to an increase in
the pretax income. The effective tax rates for the years ended December 31,
2015 and 2014 were 36.3 percent and 36.8 percent, respectively.
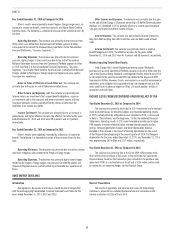
Year Ended December 31, 2014 as Compared to 2013
Regulated Utilities’ results were positively impacted by higher retail
pricing and rate riders, favorable weather, an increase in wholesale power
margins, retail sales growth, and 2013 impairments and other charges. These
impacts were partially offset by higher depreciation and amortization expense,
higher operation and maintenance costs, higher interest expense, and higher
income tax expense. The following is a detailed discussion of the variance
drivers by line item.
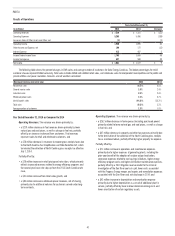
Operating Revenues. The variance was driven primarily by:
• a $614 million increase in fuel revenues driven primarily by increased
demand from electric retail customers resulting from favorable weather
conditions, and higher fuel rates for electric retail customers for all
jurisdictions, except North Carolina. Fuel revenues represent sales to
retail and wholesale customers;
• a $556 million net increase in retail pricing primarily due to retail rate
changes and updated rate riders;
• a $216 million increase in electric sales (net of fuel revenue) to retail
customers due to more favorable weather conditions across the service
territory. Compared to normal, weather was favorable in the Carolinas
and Florida service territories, while weather in the Midwest was
essentially normal;
• a $63 million increase in wholesale power revenues, net of sharing,
primarily due to additional volumes and capacity charges for customers
served under long-term contracts; and
• a $21 million increase from retail sales growth (net of fuel revenue)
reflecting increased demand.
Partially offset by:
• a $139 million decrease in gross receipts tax revenue due to the NC Tax
Simplification and Rate Reduction Act which terminated the collection
of the North Carolina gross receipts tax effective July 1, 2014.
Operating Expenses. The variance was driven primarily by:
• a $611 million increase in fuel expense (including purchased power and
natural gas purchases for resale) primarily related to (i) higher volumes
of coal, and oil used in electric generation due primarily to increased
generation resulting from favorable weather conditions, (ii) higher
natural gas prices, and (iii) the application of the Nuclear Electric
Insurance Limited (NEIL) settlement proceeds in 2013 for Duke Energy
Florida;
• a $436 million increase in depreciation and amortization expense
primarily due to increases in depreciation as a result of additional
plant in service and amortization of regulatory assets, and higher 2013
reductions to cost of removal reserves in accordance with regulatory
orders; and
• a $292 million increase in operating and maintenance expense
primarily due to a litigation reserve related to the criminal investigation
of the Dan River coal ash spill (see Note 5 to the Consolidated Financial
Statements, “Commitments and Contingencies,” for additional
information), higher storm costs, repairs and remediation expenses
associated with the Dan River coal ash discharge and other ash basin
related assessment costs, and higher nuclear costs, including nuclear
outage levelization costs, and higher environmental and operational
costs that are recoverable in rates; partially offset by a 2013 Crystal
River Unit 3 related settlement matter, decreased benefits costs
and 2013 donations for low-income customers and job training in
accordance with 2013 NCUC and PSCSC rate case orders.
Partially offset by:
• a $346 million decrease due to the 2013 impairment and other charges
primarily related to Crystal River Unit 3 and the proposed Levy Nuclear
Station (Levy). See Note 4 to the Consolidated Financial Statements,
“Regulatory Matters,” for additional information;
• a $42 million decrease in property and other taxes primarily due to the
termination of the collection of the North Carolina gross receipts tax as
mentioned above; partially offset by a sales tax reserve as a result of
an Indiana sales tax audit, and higher property taxes; and
• a $22 million decrease due to the 2013 impairment resulting from the
decision to suspend the application for two proposed nuclear units at
Shearon Harris Nuclear Plant (Harris).
Other Income and Expenses, net. The variance is primarily due
to recognition of post in-service equity returns for projects that had been
completed prior to being reflected in customer rates, partially offset by lower
Allowance for Funds Used During Construction (AFUDC) equity, primarily due to
placing the Sutton Plant into service in late 2013.
Interest Expense. The variance was primarily due to no longer recording
post in-service debt returns on projects reflected in customer rates and a
reduction in debt return on the Crystal River Unit 3 regulatory asset recovered
through fuel revenues.
Income Tax Expense. The variance was primarily due to higher pretax
income, partially offset by a lower effective tax rate of 36.8 percent compared to
37.8 percent, respectively, for the years ended December 31, 2014 and 2013.
The decrease in effective tax rate is primarily due to favorable audit settlements,
a higher manufacturing deduction due to prior year limitations based on
taxable income, and changes in income apportionment for state income tax,
partially offset by the non-deductible litigation reserve related to the criminal
investigation of the Dan River coal ash spill.
Matters Impacting Future Regulated Utilities Results
Duke Energy is a party to multiple lawsuits and could be subject to fines
and other penalties related to the Dan River coal ash release and operations at
other North Carolina facilities with ash basins. The outcome of these lawsuits
and potential fines and penalties could have an adverse impact on Regulated
Utilities’ financial position, results of operations and cash flows. See Note 5 to
the Consolidated Financial Statements, “Commitments and Contingencies,” for
additional information.