Duke Energy 2015 Annual Report Download - page 62
Download and view the complete annual report
Please find page 62 of the 2015 Duke Energy annual report below. You can navigate through the pages in the report by either clicking on the pages listed below, or by using the keyword search tool below to find specific information within the annual report.-
 1
1 -
2
-
3
-
4
-
5
-
6
-
7
-
8
-
9
-
10
-
11
-
12
-
13
-
14
-
15
-
16
-
17
-
18
-
19
-
20
-
21
-
22
-
23
-
24
-
25
-
26
-
27
-
28
-
29
-
30
-
31
-
32
-
33
-
34
-
35
-
36
-
37
-
38
-
39
-
40
-
41
-
42
-
43
-
44
-
45
-
46
-
47
-
48
-
49
-
50
-
51
-
 52
52 -
 53
53 -
 54
54 -
 55
55 -
 56
56 -
 57
57 -
 58
58 -
 59
59 -
 60
60 -
 61
61 -
 62
62 -
 63
63 -
 64
64 -
 65
65 -
 66
66 -
 67
67 -
 68
68 -
 69
69 -
 70
70 -
 71
71 -
 72
72 -
73
-
74
-
75
-
76
-
77
-
78
-
79
-
80
-
81
-
82
-
83
-
84
-
85
-
86
-
87
-
88
-
89
-
90
-
91
-
92
-
93
-
94
-
95
-
96
-
97
-
98
-
99
-
100
-
101
-
102
-
103
-
104
-
105
-
106
-
107
-
108
-
109
-
110
-
111
-
112
-
113
-
114
-
115
-
116
-
117
-
118
-
119
-
120
-
121
-
122
-
123
-
124
-
125
-
126
-
127
-
128
-
129
-
130
-
131
-
132
-
133
-
134
-
135
-
136
-
137
-
138
-
139
-
140
-
141
-
142
-
143
-
144
-
145
-
146
-
147
-
148
-
149
-
150
-
151
-
152
-
153
-
154
-
155
-
156
-
157
-
158
-
159
-
160
-
161
-
162
-
163
-
164
-
165
-
166
-
167
-
168
-
169
-
170
-
171
-
172
-
173
-
174
-
175
-
176
-
177
-
178
-
179
-
180
-
181
-
182
-
183
-
184
-
185
-
186
-
187
-
188
-
189
-
190
-
191
-
192
-
193
-
194
-
195
-
196
-
197
-
198
-
199
-
200
-
201
-
202
-
203
-
204
-
205
-
206
-
207
-
208
-
209
-
210
-
211
-
212
-
213
-
214
-
215
-
216
-
217
-
218
-
219
-
220
-
221
-
222
-
223
-
224
-
225
-
226
-
227
-
228
-
229
-
230
-
231
-
232
-
233
-
234
-
235
-
236
-
237
-
238
-
239
-
240
-
241
-
242
-
243
-
244
-
245
-
246
-
247
-
248
-
249
-
250
-
251
-
252
-
253
-
254
-
255
-
256
-
257
-
258
-
259
-
260
-
261
-
262
-
263
-
264
 |
 |

42
PART II
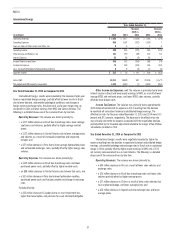
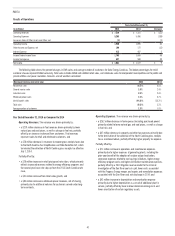
Other Income and Expenses, net. The variance was primarily due to a
decrease in recognition of post in-service equity returns for projects that had
been completed prior to being reflected in customer rates.
Income Tax Expense. The variance is primarily due to an increase in
the effective tax rate and higher pretax income. The effective tax rates for the
years ended December 31, 2015 and 2014 were 36.7 percent and 35.4 percent,
respectively. The increase in the effective tax rate is primarily due to favorable
audit settlements and changes in apportionment related to state income
tax recorded in 2014, and a lower tax benefit related to the manufacturing
deduction in 2015 as compared to 2014, partially offset by the non-deductible
litigation reserve related to the criminal investigation of the Dan River coal ash
spill recorded in 2014.
Matters Impacting Future Results
Duke Energy Carolinas is a party to multiple lawsuits and subject to fines
and other penalties related to the Dan River coal ash release and operations at
other North Carolina facilities with ash basins. The outcome of these lawsuits,
fines and penalties could have an adverse impact on Duke Energy Carolinas’
financial position, results of operations and cash flows. See Note 5 to the
Consolidated Financial Statements, “Commitments and Contingencies,” for
additional information.
An order from regulatory authorities disallowing recovery of costs related
to closure of ash impoundments could have an adverse impact on Duke Energy
Carolinas’ financial position, results of operations and cash flows. See Notes
4 and 9 to the Consolidated Financial Statements, “Regulatory Matters” and
“Asset Retirement Obligations,” respectively, for additional information.
On October 23, 2015, the EPA published in the Federal Register the
CPP rule for regulating CO2 emissions from existing fossil fuel-fired EGUs. The
CPP establishes CO2 emission rates and mass cap goals that apply to fossil
fuel-fired generation. Under the CPP, states are required to develop and submit
a final compliance plan, or an initial plan with an extension request, to the EPA
by September 6, 2016, or no later than September 6, 2018, with an approved
extension. These state plans are subject to EPA approval, with a federal plan
applied to states that fail to submit a plan to the EPA or if a state plan is
not approved. Legal challenges to the CPP have been filed by stakeholders
and motions to stay the requirements of the rule pending the outcome of the
litigation have been filed. The U.S. Supreme Court granted a Motion to Stay in
February 2016, effectively blocking enforcement of the rule until legal challenges
are resolved. Final resolution of these legal challenges could take several years.
Compliance with CPP could cause the industry to replace coal generation with
natural gas and renewables, especially in states that have significant CO2
reduction targets under the rule. Costs to operate coal-fired generation plants
continue to grow due to increasing environmental compliance requirements,
including ash management costs unrelated to CPP, and this may result in the
retirement of coal-fired generation plants earlier than the current useful lives.
Duke Energy Carolinas continues to evaluate the need to retire generating
facilities and plans to seek regulatory recovery, where appropriate, for amounts
that have not been recovered upon asset retirements. However, recovery is
subject to future regulatory approval, including the recovery of carrying costs
on remaining book values, and therefore cannot be assured. In addition, Duke
Energy Carolinas could incur increased fuel, purchased power, operation and
maintenance, and other costs for replacement generation as a result of this rule.
Duke Energy Carolinas cannot predict the outcome of these matters.
PROGRESS ENERGY
Introduction
Management’s Discussion and Analysis should be read in conjunction
with the accompanying Consolidated Financial Statements and Notes for the
years ended December 31, 2015, 2014 and 2013.
Basis of Presentation
The results of operations and variance discussion for Progress Energy is
presented in a reduced disclosure format in accordance with General Instruction
(I)(2)(a) of Form 10-K.
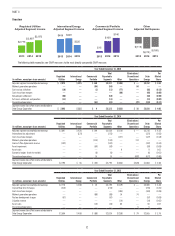
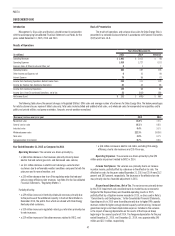
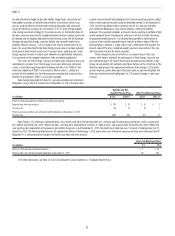
Results of Operations
Years Ended December 31,
(in millions) 2015 2014 Variance
Operating Revenues $10,277 $10,166 $ 111
Operating Expenses 8,142 8,159 (17)
Gains on Sales of Other Assets and Other, net 25 11 14
Operating Income 2,160 2,018 142
Other Income and Expense, net 97 77 20
Interest Expense 670 675 (5)
Income Before Income Taxes 1,587 1,420 167
Income Tax Expense 522 540 (18)
Income from Continuing Operations 1,065 880 185
Loss from Discontinued Operations, net of tax (3) (6) 3
Net Income 1,062 874 188
Less: Net Income Attributable to Noncontrolling Interests 11 5 6
Net Income Attributable to Parent $ 1,051 $ 869 $ 182