Duke Energy 2015 Annual Report Download - page 231
Download and view the complete annual report
Please find page 231 of the 2015 Duke Energy annual report below. You can navigate through the pages in the report by either clicking on the pages listed below, or by using the keyword search tool below to find specific information within the annual report.-
 1
1 -
2
-
3
-
4
-
5
-
6
-
7
-
8
-
9
-
10
-
11
-
12
-
13
-
14
-
15
-
16
-
17
-
18
-
19
-
20
-
21
-
22
-
23
-
24
-
25
-
26
-
27
-
28
-
29
-
30
-
31
-
32
-
33
-
34
-
35
-
36
-
37
-
38
-
39
-
40
-
41
-
42
-
43
-
44
-
45
-
46
-
47
-
48
-
49
-
50
-
51
-
52
-
53
-
54
-
55
-
56
-
57
-
58
-
59
-
60
-
61
-
62
-
63
-
64
-
65
-
66
-
67
-
68
-
69
-
70
-
71
-
72
-
73
-
74
-
75
-
76
-
77
-
78
-
79
-
80
-
81
-
82
-
83
-
84
-
85
-
86
-
87
-
88
-
89
-
90
-
91
-
92
-
93
-
94
-
95
-
96
-
97
-
98
-
99
-
100
-
101
-
102
-
103
-
104
-
105
-
106
-
107
-
108
-
109
-
110
-
111
-
112
-
113
-
114
-
115
-
116
-
117
-
118
-
119
-
120
-
121
-
122
-
123
-
124
-
125
-
126
-
127
-
128
-
129
-
130
-
131
-
132
-
133
-
134
-
135
-
136
-
137
-
138
-
139
-
140
-
141
-
142
-
143
-
144
-
145
-
146
-
147
-
148
-
149
-
150
-
151
-
152
-
153
-
154
-
155
-
156
-
157
-
158
-
159
-
160
-
161
-
162
-
163
-
164
-
165
-
166
-
167
-
168
-
169
-
170
-
171
-
172
-
173
-
174
-
175
-
176
-
177
-
178
-
179
-
180
-
181
-
182
-
183
-
184
-
185
-
186
-
187
-
188
-
189
-
190
-
191
-
192
-
193
-
194
-
195
-
196
-
197
-
198
-
199
-
200
-
201
-
202
-
203
-
204
-
205
-
206
-
207
-
208
-
209
-
210
-
211
-
212
-
213
-
214
-
215
-
216
-
217
-
218
-
219
-
220
-
 221
221 -
 222
222 -
 223
223 -
 224
224 -
 225
225 -
 226
226 -
 227
227 -
 228
228 -
 229
229 -
 230
230 -
 231
231 -
 232
232 -
 233
233 -
 234
234 -
 235
235 -
 236
236 -
 237
237 -
 238
238 -
 239
239 -
 240
240 -
 241
241 -
242
-
243
-
244
-
245
-
246
-
247
-
248
-
249
-
250
-
251
-
252
-
253
-
254
-
255
-
256
-
257
-
258
-
259
-
260
-
261
-
262
-
263
-
264
 |
 |

211
PART II
DUKE ENERGY CORPORATION • DUKE ENERGY CAROLINAS, LLC • PROGRESS ENERGY, INC. •
DUKE ENERGY PROGRESS, LLC. • DUKE ENERGY FLORIDA, LLC. • DUKE ENERGY OHIO, INC. • DUKE ENERGY INDIANA, INC.
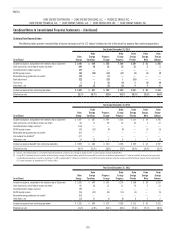
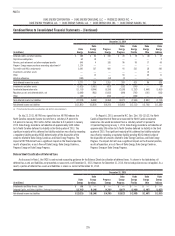
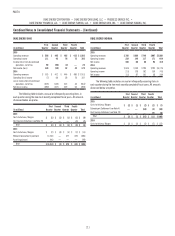
Combined Notes to Consolidated Financial Statements – (Continued)
DUKE ENERGY OHIO
(in millions)
First
Quarter
Second
Quarter
Third
Quarter
Fourth
Quarter Total
2015
Operating revenues $ 586 $ 405 $ 462 $ 452 $ 1,905
Operating income 111 43 76 73 303
Income (loss) from discontinued
operations, net of tax 90 (65) (2) — 23
Net income (loss) 149 (52) 32 43 172
2014
Operating revenues $ 575 $ 412 $ 446 $ 480 $ 1,913
Operating (loss) income (7) 60 58 76 187
(Loss) Income from discontinued
operations, net of tax (875) (135) 413 34 (563)
Net (loss) income (890) (107) 439 63 (495)
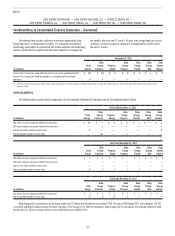
The following table includes unusual or infrequently occurring items in
each quarter during the two most recently completed fiscal years. All amounts
discussed below are pretax.
(in millions)
First
Quarter
Second
Quarter
Third
Quarter
Fourth
Quarter Total
2015
Costs to Achieve, Mergers $ (1) $ (1) $ (1) $ (1) $ (4)
Cost Savings Initiatives (see Note 19) — — — (2) (2)
Total $ (1) $ (1) $ (1) $ (3) $ (6)
2014
Costs to Achieve, Mergers $ (2) $ (4) $ (3) $ (2) $ (11)
Midwest Generation Impairment (1,318) —477 (39) (880)
Asset Impairment (94) ———(94)
Total $ (1,414) $ (4) $ 474 $ (41) $ (985)
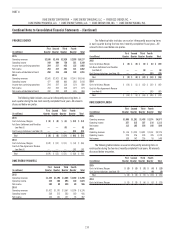
DUKE ENERGY INDIANA
(in millions)
First
Quarter
Second
Quarter
Third
Quarter
Fourth
Quarter Total
2015
Operating revenues $ 788 $686 $749 $667 $2,890
Operating income 210 146 117 171 644
Net income 108 68 46 94 316
2014
Operating revenues $ 845 $ 748 $790 $792 $3,175
Operating income 215 178 182 130 705
Net income 113 87 101 58 359
The following table includes unusual or infrequently occurring items in
each quarter during the two most recently completed fiscal years. All amounts
discussed below are pretax.
(in millions)
First
Quarter
Second
Quarter
Third
Quarter
Fourth
Quarter Total
2015
Costs to Achieve, Mergers $ (2) $ (1) $ (2) $ (2) $ (7)
Edwardsport Settlement (see Note 4) — — (90) (3) (93)
Cost Savings Initiatives (see Note 19) — — — (6) (6)
Total $ (2) $ (1) $ (92) $ (11) $ (106)
2014
Costs to Achieve, Mergers $ (2) $ (5) $ (3) $ (2) $ (12)