Duke Energy 2015 Annual Report Download - page 135
Download and view the complete annual report
Please find page 135 of the 2015 Duke Energy annual report below. You can navigate through the pages in the report by either clicking on the pages listed below, or by using the keyword search tool below to find specific information within the annual report.-
 1
1 -
2
-
3
-
4
-
5
-
6
-
7
-
8
-
9
-
10
-
11
-
12
-
13
-
14
-
15
-
16
-
17
-
18
-
19
-
20
-
21
-
22
-
23
-
24
-
25
-
26
-
27
-
28
-
29
-
30
-
31
-
32
-
33
-
34
-
35
-
36
-
37
-
38
-
39
-
40
-
41
-
42
-
43
-
44
-
45
-
46
-
47
-
48
-
49
-
50
-
51
-
52
-
53
-
54
-
55
-
56
-
57
-
58
-
59
-
60
-
61
-
62
-
63
-
64
-
65
-
66
-
67
-
68
-
69
-
70
-
71
-
72
-
73
-
74
-
75
-
76
-
77
-
78
-
79
-
80
-
81
-
82
-
83
-
84
-
85
-
86
-
87
-
88
-
89
-
90
-
91
-
92
-
93
-
94
-
95
-
96
-
97
-
98
-
99
-
100
-
101
-
102
-
103
-
104
-
105
-
106
-
107
-
108
-
109
-
110
-
111
-
112
-
113
-
114
-
115
-
116
-
117
-
118
-
119
-
120
-
121
-
122
-
123
-
124
-
 125
125 -
 126
126 -
 127
127 -
 128
128 -
 129
129 -
 130
130 -
 131
131 -
 132
132 -
 133
133 -
 134
134 -
 135
135 -
 136
136 -
 137
137 -
 138
138 -
 139
139 -
 140
140 -
 141
141 -
 142
142 -
 143
143 -
 144
144 -
 145
145 -
146
-
147
-
148
-
149
-
150
-
151
-
152
-
153
-
154
-
155
-
156
-
157
-
158
-
159
-
160
-
161
-
162
-
163
-
164
-
165
-
166
-
167
-
168
-
169
-
170
-
171
-
172
-
173
-
174
-
175
-
176
-
177
-
178
-
179
-
180
-
181
-
182
-
183
-
184
-
185
-
186
-
187
-
188
-
189
-
190
-
191
-
192
-
193
-
194
-
195
-
196
-
197
-
198
-
199
-
200
-
201
-
202
-
203
-
204
-
205
-
206
-
207
-
208
-
209
-
210
-
211
-
212
-
213
-
214
-
215
-
216
-
217
-
218
-
219
-
220
-
221
-
222
-
223
-
224
-
225
-
226
-
227
-
228
-
229
-
230
-
231
-
232
-
233
-
234
-
235
-
236
-
237
-
238
-
239
-
240
-
241
-
242
-
243
-
244
-
245
-
246
-
247
-
248
-
249
-
250
-
251
-
252
-
253
-
254
-
255
-
256
-
257
-
258
-
259
-
260
-
261
-
262
-
263
-
264
 |
 |

115
PART II
DUKE ENERGY CORPORATION • DUKE ENERGY CAROLINAS, LLC • PROGRESS ENERGY, INC. •
DUKE ENERGY PROGRESS, LLC. • DUKE ENERGY FLORIDA, LLC. • DUKE ENERGY OHIO, INC. • DUKE ENERGY INDIANA, INC.
Combined Notes to Consolidated Financial Statements – (Continued)
DISPOSITIONS
Potential Sale of International Energy
On February 18, 2016, Duke Energy announced it had initiated a process
to divest the International Energy business segment, excluding the equity
method investment in National Methanol Company (NMC). Duke Energy is in
the preliminary stage and there have been no binding or non-binding offers
requested or submitted. Duke Energy can provide no assurance that this process
will result in a transaction and there is no specific timeline for execution of a
potential transaction. Proceeds from a successful exit would be used by Duke
Energy to fund the operations and growth of domestic businesses. If the potential
of a sale were to progress, it could result in classification of International Energy
as assets held for sale and as a discontinued operation. As of December 31,
2015, the International Energy segment had a carrying value of approximately
$2.7 billion, adjusted to include the cumulative foreign currency translation
losses currently classified as accumulated other comprehensive income.
Midwest Generation Exit
Duke Energy, through indirect subsidiaries, completed the sale of the
nonregulated Midwest generation business and Duke Energy Retail Sales
(collectively, the Disposal Group) to a subsidiary of Dynegy on April 2, 2015,
for approximately $2.8 billion in cash. On April 1, 2015, prior to the sale, Duke
Energy Ohio distributed its indirect ownership interest in the nonregulated
Midwest generation business to a subsidiary of Duke Energy Corporation.
The assets and liabilities of the Disposal Group prior to the sale were
included in the Commercial Portfolio (formerly Commercial Power) segment
and classified as held for sale in Duke Energy’s and Duke Energy Ohio’s
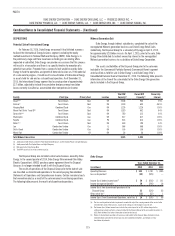
Consolidated Balance Sheet at December 31, 2014. The following table presents
information at the time of the sale related to the Duke Energy Ohio generation
plants included in the Disposal Group.
Facility Plant Type Primary Fuel Location
Total MW
Capacity
(d)
Owned MW
Capacity(d)
Ownership
Interest
Stuart(a)(c) Fossil Steam Coal OH 2,308 900 39%
Zimmer(a) Fossil Steam Coal OH 1,300 605 46.5%
Hanging Rock Combined Cycle Gas OH 1,226 1,226 100%
Miami Fort (Units 7 and 8)(b) Fossil Steam Coal OH 1,020 652 64%
Conesville(a)(c) Fossil Steam Coal OH 780 312 40%
Washington Combined Cycle Gas OH 617 617 100%
Fayette Combined Cycle Gas PA 614 614 100%
Killen(b)(c) Fossil Steam Coal OH 600 198 33%
Lee Combustion Turbine Gas IL 568 568 100%
Dick's Creek Combustion Turbine Gas OH 136 136 100%
Miami Fort Combustion Turbine Oil OH 56 56 100%
Total Midwest Generation 9,225 5,884
(a) Jointly owned with American Electric Power Generation Resources and The Dayton Power and Light Company.
(b) Jointly owned with The Dayton Power and Light Company.
(c) Not operated by Duke Energy Ohio.
(d) Total MW capacity is based on summer capacity.
The Disposal Group also included a retail sales business owned by Duke
Energy. In the second quarter of 2014, Duke Energy Ohio removed Ohio Valley
Electric Corporation’s (OVEC) purchase power agreement from the Disposal
Group as it no longer intended to sell it with the Disposal Group.
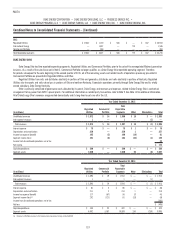
The results of operations of the Disposal Group prior to the date of sale
are classified as discontinued operations in the accompanying Consolidated
Statements of Operations and Comprehensive Income. Certain immaterial costs
that were eliminated as a result of the sale remained in continuing operations.
The following table presents the results of discontinued operations.
Duke Energy
Years Ended December 31,
(in millions) 2015 2014 2013
Operating Revenues $ 543 $ 1,748 $ 1,885
Loss on disposition(a) (45) (929) —
Income (loss) before income taxes(b) $ 59 $ (818) $ 141
Income tax expense (benefit) 26 (294) 56
Income (loss) from discontinued operations of the
Disposal Group 33 (524) 85
Other, net of tax(c) (13) (52) 1
Income (Loss) From Discontinued Operations, net of tax $ 20 $ (576) $ 86
(a) The Loss on disposition includes impairments recorded to adjust the carrying amount of the assets to the
estimated fair value of the business, based on the selling price to Dynegy less cost to sell.
(b) The Income (loss) before income taxes includes the pretax impact of an $81 million charge for the
settlement agreement reached in a lawsuit related to the Disposal Group for the year ended December 31,
2015. Refer to Note 5 for further information related to the lawsuit.
(c) Relates to discontinued operations of businesses not related to the Disposal Group. Amounts include
indemnifications provided for certain legal, tax and environmental matters, and foreign currency
translation adjustments.