Duke Energy 2015 Annual Report Download - page 180
Download and view the complete annual report
Please find page 180 of the 2015 Duke Energy annual report below. You can navigate through the pages in the report by either clicking on the pages listed below, or by using the keyword search tool below to find specific information within the annual report.-
 1
1 -
2
-
3
-
4
-
5
-
6
-
7
-
8
-
9
-
10
-
11
-
12
-
13
-
14
-
15
-
16
-
17
-
18
-
19
-
20
-
21
-
22
-
23
-
24
-
25
-
26
-
27
-
28
-
29
-
30
-
31
-
32
-
33
-
34
-
35
-
36
-
37
-
38
-
39
-
40
-
41
-
42
-
43
-
44
-
45
-
46
-
47
-
48
-
49
-
50
-
51
-
52
-
53
-
54
-
55
-
56
-
57
-
58
-
59
-
60
-
61
-
62
-
63
-
64
-
65
-
66
-
67
-
68
-
69
-
70
-
71
-
72
-
73
-
74
-
75
-
76
-
77
-
78
-
79
-
80
-
81
-
82
-
83
-
84
-
85
-
86
-
87
-
88
-
89
-
90
-
91
-
92
-
93
-
94
-
95
-
96
-
97
-
98
-
99
-
100
-
101
-
102
-
103
-
104
-
105
-
106
-
107
-
108
-
109
-
110
-
111
-
112
-
113
-
114
-
115
-
116
-
117
-
118
-
119
-
120
-
121
-
122
-
123
-
124
-
125
-
126
-
127
-
128
-
129
-
130
-
131
-
132
-
133
-
134
-
135
-
136
-
137
-
138
-
139
-
140
-
141
-
142
-
143
-
144
-
145
-
146
-
147
-
148
-
149
-
150
-
151
-
152
-
153
-
154
-
155
-
156
-
157
-
158
-
159
-
160
-
161
-
162
-
163
-
164
-
165
-
166
-
167
-
168
-
169
-
 170
170 -
 171
171 -
 172
172 -
 173
173 -
 174
174 -
 175
175 -
 176
176 -
 177
177 -
 178
178 -
 179
179 -
 180
180 -
 181
181 -
 182
182 -
 183
183 -
 184
184 -
 185
185 -
 186
186 -
 187
187 -
 188
188 -
 189
189 -
 190
190 -
191
-
192
-
193
-
194
-
195
-
196
-
197
-
198
-
199
-
200
-
201
-
202
-
203
-
204
-
205
-
206
-
207
-
208
-
209
-
210
-
211
-
212
-
213
-
214
-
215
-
216
-
217
-
218
-
219
-
220
-
221
-
222
-
223
-
224
-
225
-
226
-
227
-
228
-
229
-
230
-
231
-
232
-
233
-
234
-
235
-
236
-
237
-
238
-
239
-
240
-
241
-
242
-
243
-
244
-
245
-
246
-
247
-
248
-
249
-
250
-
251
-
252
-
253
-
254
-
255
-
256
-
257
-
258
-
259
-
260
-
261
-
262
-
263
-
264
 |
 |

160
PART II
DUKE ENERGY CORPORATION • DUKE ENERGY CAROLINAS, LLC • PROGRESS ENERGY, INC. •
DUKE ENERGY PROGRESS, LLC • DUKE ENERGY FLORIDA, LLC • DUKE ENERGY OHIO, INC. • DUKE ENERGY INDIANA, INC.
Combined Notes to Consolidated Financial Statements – (Continued)
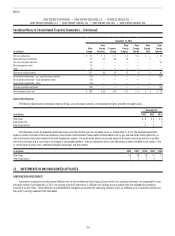
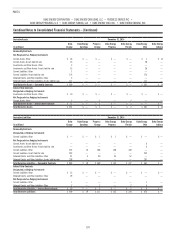
OFFSETTING ASSETS AND LIABILITIES
The following tables present the line items on the Consolidated Balance Sheets where derivatives are reported. Substantially all of Duke Energy’s outstanding
derivative contracts are subject to enforceable master netting arrangements. The Gross amounts offset in the tables below show the effect of these netting
arrangements on financial position, and include collateral posted to offset the net position. The amounts shown are calculated by counterparty. Accounts receivable or
accounts payable may also be available to offset exposures in the event of bankruptcy. These amounts are not included in the tables below.
Derivative Assets December 31, 2015
(in millions)
Duke
Energy
Duke Energy
Carolinas
Progress
Energy
Duke Energy
Progress
Duke Energy
Florida
Duke Energy
Ohio
Duke Energy
Indiana
Current
Gross amounts recognized $ 18 $ — $ 7 $ 2 $ 3 $ 3 $ 7
Gross amounts offset (3) — (2) — (2) — —
Net amounts presented in Current Assets: Other $ 15 $ — $ 5 $ 2 $ 1 $ 3 $ 7
Noncurrent
Gross amounts recognized $ 8 $ — $ 4 $ — $ 4 $ — $ —
Gross amounts offset (4) — (4) — (4) — —
Net amounts presented in Investments and Other Assets: Other $ 4 $ — $ — $ — $ — $ — $ —
Derivative Liabilities December 31, 2015
(in millions)
Duke
Energy
Duke Energy
Carolinas
Progress
Energy
Duke Energy
Progress
Duke Energy
Florida
Duke Energy
Ohio
Duke Energy
Indiana
Current
Gross amounts recognized $ 271 $ 32 $ 225 $ 77 $ 145 $ 1 $ —
Gross amounts offset (22) — (21) (1) (20) — —
Net amounts presented in Current Liabilities: Other $ 249 $ 32 $ 204 $ 76 $ 125 $ 1 $ —
Noncurrent
Gross amounts recognized $ 148 $ 13 $ 97 $ 21 $ 71 $ 6 $ —
Gross amounts offset (16) — (15) — (15) — —
Net amounts presented in Deferred Credits and Other Liabilities:
Other $ 132 $ 13 $ 82 $ 21 $ 56 $ 6 $ —