Duke Energy 2015 Annual Report Download - page 7
Download and view the complete annual report
Please find page 7 of the 2015 Duke Energy annual report below. You can navigate through the pages in the report by either clicking on the pages listed below, or by using the keyword search tool below to find specific information within the annual report.-
 1
1 -
 2
2 -
 3
3 -
 4
4 -
 5
5 -
 6
6 -
 7
7 -
 8
8 -
 9
9 -
 10
10 -
 11
11 -
 12
12 -
 13
13 -
 14
14 -
 15
15 -
 16
16 -
 17
17 -
 18
18 -
19
-
20
-
21
-
22
-
23
-
24
-
25
-
26
-
27
-
28
-
29
-
30
-
31
-
32
-
33
-
34
-
35
-
36
-
37
-
38
-
39
-
40
-
41
-
42
-
43
-
44
-
45
-
46
-
47
-
48
-
49
-
50
-
51
-
52
-
53
-
54
-
55
-
56
-
57
-
58
-
59
-
60
-
61
-
62
-
63
-
64
-
65
-
66
-
67
-
68
-
69
-
70
-
71
-
72
-
73
-
74
-
75
-
76
-
77
-
78
-
79
-
80
-
81
-
82
-
83
-
84
-
85
-
86
-
87
-
88
-
89
-
90
-
91
-
92
-
93
-
94
-
95
-
96
-
97
-
98
-
99
-
100
-
101
-
102
-
103
-
104
-
105
-
106
-
107
-
108
-
109
-
110
-
111
-
112
-
113
-
114
-
115
-
116
-
117
-
118
-
119
-
120
-
121
-
122
-
123
-
124
-
125
-
126
-
127
-
128
-
129
-
130
-
131
-
132
-
133
-
134
-
135
-
136
-
137
-
138
-
139
-
140
-
141
-
142
-
143
-
144
-
145
-
146
-
147
-
148
-
149
-
150
-
151
-
152
-
153
-
154
-
155
-
156
-
157
-
158
-
159
-
160
-
161
-
162
-
163
-
164
-
165
-
166
-
167
-
168
-
169
-
170
-
171
-
172
-
173
-
174
-
175
-
176
-
177
-
178
-
179
-
180
-
181
-
182
-
183
-
184
-
185
-
186
-
187
-
188
-
189
-
190
-
191
-
192
-
193
-
194
-
195
-
196
-
197
-
198
-
199
-
200
-
201
-
202
-
203
-
204
-
205
-
206
-
207
-
208
-
209
-
210
-
211
-
212
-
213
-
214
-
215
-
216
-
217
-
218
-
219
-
220
-
221
-
222
-
223
-
224
-
225
-
226
-
227
-
228
-
229
-
230
-
231
-
232
-
233
-
234
-
235
-
236
-
237
-
238
-
239
-
240
-
241
-
242
-
243
-
244
-
245
-
246
-
247
-
248
-
249
-
250
-
251
-
252
-
253
-
254
-
255
-
256
-
257
-
258
-
259
-
260
-
261
-
262
-
263
-
264
 |
 |

2015 ANNUAL REPORT / 5 /
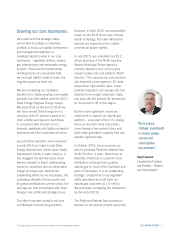
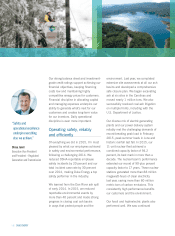
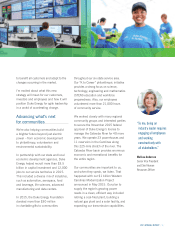
“ Doubling the dividend
growth rate in 2015
is another important
way we’re committed
to meeting investors’
expectations.”
Steve Young
Executive Vice President
and Chief Financial Ofcer
Driving predictable
nancial results
As a sign of condence in the company’s
nancial health, our Board of Directors in
2015 doubled the annual growth rate of
our dividend to approximately 4 percent.
We now pay more than $2.2 billion
annually in dividends and have paid
a quarterly dividend on our common
stock for 90 consecutive years.
In 2015, we delivered adjusted diluted
earnings per share of $4.54, a penny
below our guidance range of $4.55
to $4.65 per share. For reasons cited
earlier, Duke Energy International
contributed only about 65 percent of
the net income we originally expected.
The strength in our core businesses,
as well as early execution on a number
of strategic initiatives, helped us offset
this weakness.
Our total shareholder return was negative
10.8 percent in 2015, following a very
strong year in 2014 when the total
return was 26.4 percent. The utility
industry signicantly underperformed the
broad market in 2015, in part, because
of the expectation of rising interest rates
and the premium valuations from
the prior year’s robust performance.
The total shareholder return of the
Philadelphia Utility Index (UTY)
was negative 6.3 percent in 2015,
compared with 28.9 percent in
2014. The uncertainty around our
international business and the impact
to our long-term growth rate impacted
our overall performance in 2015
and, to a lesser extent, 2014.
As noted, we have announced our
intent to exit this business and will
work to achieve an orderly sale of
these high-quality assets.
This February, we announced our
2016 adjusted diluted earnings guidance
range of $4.50 to $4.70 per share. We
are well-positioned to meet our long-term
4 to 6 percent annual growth objective
from 2016 to 2020. This is driven
by our growth capital plan to invest
approximately $25 billion to $30 billion
in our core businesses over the ve years,
by projected annual retail load growth
of 0.50 percent, and by expansion of
wholesale power. We also plan to
hold our operating and maintenance
expenses at through 2020.