Duke Energy 2015 Annual Report Download - page 60
Download and view the complete annual report
Please find page 60 of the 2015 Duke Energy annual report below. You can navigate through the pages in the report by either clicking on the pages listed below, or by using the keyword search tool below to find specific information within the annual report.-
 1
1 -
2
-
3
-
4
-
5
-
6
-
7
-
8
-
9
-
10
-
11
-
12
-
13
-
14
-
15
-
16
-
17
-
18
-
19
-
20
-
21
-
22
-
23
-
24
-
25
-
26
-
27
-
28
-
29
-
30
-
31
-
32
-
33
-
34
-
35
-
36
-
37
-
38
-
39
-
40
-
41
-
42
-
43
-
44
-
45
-
46
-
47
-
48
-
49
-
 50
50 -
 51
51 -
 52
52 -
 53
53 -
 54
54 -
 55
55 -
 56
56 -
 57
57 -
 58
58 -
 59
59 -
 60
60 -
 61
61 -
 62
62 -
 63
63 -
 64
64 -
 65
65 -
 66
66 -
 67
67 -
 68
68 -
 69
69 -
 70
70 -
71
-
72
-
73
-
74
-
75
-
76
-
77
-
78
-
79
-
80
-
81
-
82
-
83
-
84
-
85
-
86
-
87
-
88
-
89
-
90
-
91
-
92
-
93
-
94
-
95
-
96
-
97
-
98
-
99
-
100
-
101
-
102
-
103
-
104
-
105
-
106
-
107
-
108
-
109
-
110
-
111
-
112
-
113
-
114
-
115
-
116
-
117
-
118
-
119
-
120
-
121
-
122
-
123
-
124
-
125
-
126
-
127
-
128
-
129
-
130
-
131
-
132
-
133
-
134
-
135
-
136
-
137
-
138
-
139
-
140
-
141
-
142
-
143
-
144
-
145
-
146
-
147
-
148
-
149
-
150
-
151
-
152
-
153
-
154
-
155
-
156
-
157
-
158
-
159
-
160
-
161
-
162
-
163
-
164
-
165
-
166
-
167
-
168
-
169
-
170
-
171
-
172
-
173
-
174
-
175
-
176
-
177
-
178
-
179
-
180
-
181
-
182
-
183
-
184
-
185
-
186
-
187
-
188
-
189
-
190
-
191
-
192
-
193
-
194
-
195
-
196
-
197
-
198
-
199
-
200
-
201
-
202
-
203
-
204
-
205
-
206
-
207
-
208
-
209
-
210
-
211
-
212
-
213
-
214
-
215
-
216
-
217
-
218
-
219
-
220
-
221
-
222
-
223
-
224
-
225
-
226
-
227
-
228
-
229
-
230
-
231
-
232
-
233
-
234
-
235
-
236
-
237
-
238
-
239
-
240
-
241
-
242
-
243
-
244
-
245
-
246
-
247
-
248
-
249
-
250
-
251
-
252
-
253
-
254
-
255
-
256
-
257
-
258
-
259
-
260
-
261
-
262
-
263
-
264
 |
 |

40
PART II
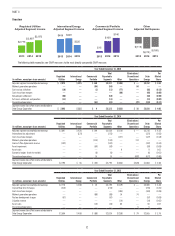
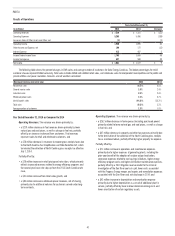
Year Ended December 31, 2015 as Compared to 2014
Other’s results were impacted by lower Progress Energy merger costs, an
increase in income tax benefit, severance accruals, and higher North Carolina
franchise taxes. The following is a detailed discussion of the variance drivers by
line item.
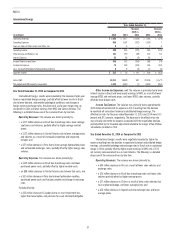
Operating Revenues. The increase was primarily due to revenues from
OVEC, which was shifted from the Commercial Portfolio segment to Other
subsequent to the sale of the Disposal Group (see Note 3 to the Consolidated
Financial Statements, “Business Segments.”)
Operating Expenses. The increase was primarily due to severance
accruals, higher charges in the current year due to the shift of the residual
Midwest Generation business from the Commercial Portfolio segment to Other
in 2015 (see Note 3 to the Consolidated Financial Statements, “Business
Segments,”) and higher North Carolina franchise taxes, partially offset by lower
charges related to the Progress Energy merger and higher prior-year captive
insurance loss experience.
Gains on Sales of Other Assets and Other, net. The variance was
primarily due to the gain on sale of telecommunication leases.
Other Income and Expenses, net. The variance was primarily due
to lower returns on investments that support benefit obligations, a gain on
an investment sale in the prior year and lower investment income at Bison
Insurance Company Limited, partially offset by interest income from the
resolution of an income tax matter.
Income Tax Benefit. The variance was primarily due to an increase in
pretax losses and higher effective tax rate. The effective tax rates for the years
ended December 31, 2015 and 2014 were 49.3 percent and 41.9 percent,
respectively.
Year Ended December 31, 2014 as Compared to 2013
Other’s results were negatively impacted by a decrease in income tax
benefit. The following is a detailed discussion of the variance drivers by line
item.
Operating Revenues. The decrease was primarily due to mark-to-market
activity of mitigation sales related to the Progress Energy merger.
Operating Expenses. The decrease was primarily due to lower charges
related to the Progress Energy merger and prior year Crescent Resources LLC
(Crescent) litigation reserve, partially offset by unfavorable loss experience at
Bison.
Other Income and Expenses. The decrease was primarily due to a gain
on the sale of Duke Energy’s 50 percent ownership in DukeNet Communications
Holdings, LLC (DukeNet) in 2013, partially offset by a current year investment
sale gain and higher investment income at Bison.
Interest Expense. The variance was due primarily to lower interest on
long-term debt resulting from debt maturities and new debt issued at lower
rates.
Income Tax Benefit. The variance was primarily due to a state tax
benefit recognized in 2013. The effective tax rates for the years ended
December 31, 2014 and 2013 were 41.9 percent and 58.6 percent, respectively.
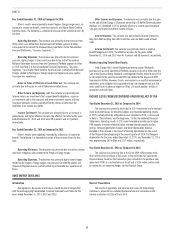
Matters Impacting Future Other Results
Duke Energy Ohio’s retired Beckjord generating station (Beckjord),
previously an asset of Commercial Portfolio, became an asset of Other after the
sale of the Disposal Group. Beckjord, a nonregulated facility retired during 2014,
is not subject to the recently enacted EPA rule related to the disposal of CCR
from electric utilities. However, if costs are incurred as a result of environmental
regulations or to mitigate risk associated with on-site storage of coal ash, the
costs could have an adverse impact on Other’s financial position, results of
operations and cash flows.
INCOME (LOSS) FROM DISCONTINUED OPERATIONS, NET OF TAX
Year Ended December 31, 2015 as Compared to 2014
The variance was primarily driven by the 2014 impairment and unrealized
mark-to-market losses on economic hedges, and favorable operating results
in 2015, partially offset by a litigation reserve recorded in 2015, as discussed
in Note 5, “Commitments and Contingencies,” to the Consolidated Financial
Statements. Operating results in 2015 were favorable primarily due to higher
PJM capacity revenues related to higher average cleared capacity auction
pricing, increased generation margins and lower depreciation expense.
Included in the variance is the impact of ceasing depreciation on the assets
of the Disposal Group beginning in the second quarter of 2014. The foregone
depreciation for the years ended December 31, 2015, and December 31, 2014,
was approximately $40 million and $117 million, respectively.
Year Ended December 31, 2014 as Compared to 2013
The variance was primarily due to the 2014 $929 million pretax write-
down of the carrying amount of the assets to the estimated fair value of the
Disposal Group, based on the transaction price included in the purchase sale
agreement (PSA), less estimated costs to sell and a $134 million pretax mark-
to-market loss on economic hedges for the Disposal Group.
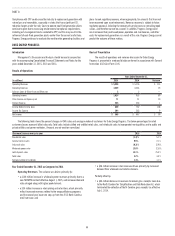
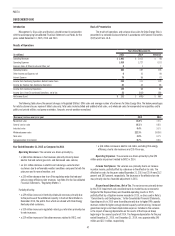
DUKE ENERGY CAROLINAS
Introduction
Management’s Discussion and Analysis should be read in conjunction
with the accompanying Consolidated Financial Statements and Notes for the
years ended December 31, 2015, 2014 and 2013.
Basis of Presentation
The results of operations and variance discussion for Duke Energy
Carolinas is presented in a reduced disclosure format in accordance with
General Instruction (I)(2)(a) of Form 10-K.