SunTrust 2015 Annual Report Download - page 99
Download and view the complete annual report
Please find page 99 of the 2015 SunTrust annual report below. You can navigate through the pages in the report by either clicking on the pages listed below, or by using the keyword search tool below to find specific information within the annual report.-
 1
1 -
2
-
3
-
4
-
5
-
6
-
7
-
8
-
9
-
10
-
11
-
12
-
13
-
14
-
15
-
16
-
17
-
18
-
19
-
20
-
21
-
22
-
23
-
24
-
25
-
26
-
27
-
28
-
29
-
30
-
31
-
32
-
33
-
34
-
35
-
36
-
37
-
38
-
39
-
40
-
41
-
42
-
43
-
44
-
45
-
46
-
47
-
48
-
49
-
50
-
51
-
52
-
53
-
54
-
55
-
56
-
57
-
58
-
59
-
60
-
61
-
62
-
63
-
64
-
65
-
66
-
67
-
68
-
69
-
70
-
71
-
72
-
73
-
74
-
75
-
76
-
77
-
78
-
79
-
80
-
81
-
82
-
83
-
84
-
85
-
86
-
87
-
88
-
 89
89 -
 90
90 -
 91
91 -
 92
92 -
 93
93 -
 94
94 -
 95
95 -
 96
96 -
 97
97 -
 98
98 -
 99
99 -
 100
100 -
 101
101 -
 102
102 -
 103
103 -
 104
104 -
 105
105 -
 106
106 -
 107
107 -
 108
108 -
 109
109 -
110
-
111
-
112
-
113
-
114
-
115
-
116
-
117
-
118
-
119
-
120
-
121
-
122
-
123
-
124
-
125
-
126
-
127
-
128
-
129
-
130
-
131
-
132
-
133
-
134
-
135
-
136
-
137
-
138
-
139
-
140
-
141
-
142
-
143
-
144
-
145
-
146
-
147
-
148
-
149
-
150
-
151
-
152
-
153
-
154
-
155
-
156
-
157
-
158
-
159
-
160
-
161
-
162
-
163
-
164
-
165
-
166
-
167
-
168
-
169
-
170
-
171
-
172
-
173
-
174
-
175
-
176
-
177
-
178
-
179
-
180
-
181
-
182
-
183
-
184
-
185
-
186
-
187
-
188
-
189
-
190
-
191
-
192
-
193
-
194
-
195
-
196
 |
 |
71
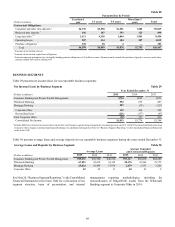
compared to 2013. Lower cost demand deposits increased $1.8
billion, or 9%, and average combined interest-bearing
transaction and money market accounts increased $2.3 billion,
or 12%, while average CD balances declined approximately
$143 million.
Provision for credit losses was $71 million, a decrease of
$53 million, or 43%, compared to 2013. The decline reflects the
continued improvement in overall Wholesale Banking credit
quality and a $56 million decline in net charge-offs, partially
offset by an increase in the provision for loan losses in the fourth
quarter of 2014 related to the decline in oil prices.
Total noninterest income was $1.1 billion, which was
virtually unchanged compared to 2013. A $49 million, or 14%,
increase in investment banking income along with higher
structured real estate gains, card fees, and non-margin loan fees
was largely offset by declines in affordable housing partnership
revenue and related gains driven by the sale of certain affordable
housing properties. Additionally, trading revenue and service
charges on treasury related services declined, and impairment
charges related to aircraft leases increased in 2014.
Total noninterest expense was $1.6 billion, an increase of
$97 million, or 7%, compared to 2013. The increase was
primarily due to an increase in employee compensation as we
continue to invest in talent to better meet our clients’ needs and
augment our capabilities, along with a reduction to incentive
compensation accruals in the first quarter of 2013. Other
expenses increased due to our strategic decision to sell certain
legacy investments in affordable housing partnerships in the first
quarter of 2014, which resulted in a net $21 million impairment
charge in 2014. These increases in expense were partially offset
by a decrease in operating losses driven by a $32 million
settlement of legal matters in the third quarter of 2013 and lower
affordable housing partnership expense.
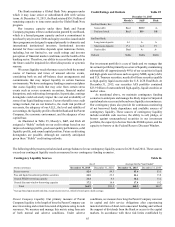
Mortgage Banking
Mortgage Banking reported a net loss of $53 million for the year
ended December 31, 2014, compared to a net loss of $527 million
for 2013. The 2014 results included $324 million of Form 8-K
and other legacy mortgage-related items as presented in Table
1, "Selected Financial Data and Reconcilement of Non-U.S.
GAAP Measures."
Net interest income was $552 million, an increase of $13
million, or 2%, primarily due to higher net interest income on
loans, partially offset by a decline net interest income on LHFS
and deposits. Net interest income on loans increased $39 million,
primarily due to an increase in loan spreads. This increase was
partially offset by an $11 million decline in interest income on
LHFS due to a $0.7 billion, or 29%, decrease in average balances
which was driven by lower production volume in 2014, partially
negated by higher spreads. Additionally, a $14 million decline
in income on average deposits was driven by a $0.9 billion, or
27%, decline in average total deposit balances, partially offset
by higher spreads.
Provision for credit losses was $81 million, a decrease of
$89 million, or 52%, compared to 2013. The improvement was
largely attributable to improved credit quality.
Total noninterest income was $473 million, an increase of
$71 million, or 18%, compared to 2013. The increase was
primarily driven by higher mortgage servicing and other income,
partially offset by lower mortgage production income. Mortgage
servicing income of $196 million increased $109 million, driven
by lower decay, higher servicing fees, and improved net hedge
performance. Loans serviced for others were $115.5 billion, an
increase of 8%, at December 31, 2014, compared to $106.8
billion at December 31, 2013. The increase was largely
attributable to the purchase of MSRs in 2014. Mortgage loan
production income decreased $113 million due to a decline in
production volume, driven by lower refinance volume, as well
as gain on sale margins, partially offset by a $102 million decline
in the mortgage repurchase provision. The mortgage repurchase
provision in the third quarter of 2013 included $63 million related
to the settlement of certain repurchase claims with the GSEs.
Loan origination volume was $16.4 billion, a decrease of $13.5
billion, or 45%, for the year ended December 31, 2014, compared
to 2013. Other income increased $75 million, primarily driven
by gains on the sale of $2.0 billion of government-guaranteed
residential mortgages that were transferred to LHFS in the
second quarter of 2014 and subsequently sold in the third quarter
of 2014, as well as gains on government-guaranteed loans that
were sold in the second quarter of 2014.
Total noninterest expense was $1.0 billion, a decline of $454
million, or 30%, compared to 2013. Operating losses and
collection services decreased $200 million due to a $291 million
charge to settle specific mortgage related legal matters and a $96
million charge related to the increase in our allowance for
servicing advances, both recognized in the third quarter of 2013,
in addition to a decline in other operating losses. These specific
2013 charges were offset by $324 million of expenses for
mortgage related legal matters in 2014, specifically, HAMP
related charges net of the impact of the progression of other legal
related matters during 2014 and a $145 million legal provision.
Total staff expense declined $120 million driven by lower
staffing levels reflecting the decline in loan production volumes
and ongoing efforts to improve productivity. In addition, lower
mortgage production volumes resulted in declines in outside
processing costs of $33 million and credit services of $22 million.
Additionally, total allocated expense decreased $48 million in
2014.
Corporate Other
Corporate Other net income for the year ended December 31,
2014 was $434 million, a decrease of $75 million, or 15%,
compared to 2013. The decrease in income was primarily due to
a decline in net interest income and a reduction in the amount of
tax benefits resulting from the recognition of discrete items in
2013.
Net interest income in 2014 was $279 million, a decrease
of $40 million, or 13%, compared to 2013. The decrease was
primarily due to a $31 million decline in commercial loan related
swap income and $7 million of foregone RidgeWorth net interest
income. Average long-term debt increased by $2.4 billion, or
27%, and average short-term borrowings increased by $1.7
billion, or 45%, compared to 2013, driven by balance sheet
management activities.
Total noninterest income was $238 million, which was
virtually unchanged compared to 2013. Foregone RidgeWorth
trust and investment management income and higher losses on
the sale of securities AFS in 2014 was offset by the gain on the
sale of RidgeWorth in the second quarter of 2014.