SunTrust 2015 Annual Report Download - page 64
Download and view the complete annual report
Please find page 64 of the 2015 SunTrust annual report below. You can navigate through the pages in the report by either clicking on the pages listed below, or by using the keyword search tool below to find specific information within the annual report.-
 1
1 -
2
-
3
-
4
-
5
-
6
-
7
-
8
-
9
-
10
-
11
-
12
-
13
-
14
-
15
-
16
-
17
-
18
-
19
-
20
-
21
-
22
-
23
-
24
-
25
-
26
-
27
-
28
-
29
-
30
-
31
-
32
-
33
-
34
-
35
-
36
-
37
-
38
-
39
-
40
-
41
-
42
-
43
-
44
-
45
-
46
-
47
-
48
-
49
-
50
-
51
-
52
-
53
-
 54
54 -
 55
55 -
 56
56 -
 57
57 -
 58
58 -
 59
59 -
 60
60 -
 61
61 -
 62
62 -
 63
63 -
 64
64 -
 65
65 -
 66
66 -
 67
67 -
 68
68 -
 69
69 -
 70
70 -
 71
71 -
 72
72 -
 73
73 -
 74
74 -
75
-
76
-
77
-
78
-
79
-
80
-
81
-
82
-
83
-
84
-
85
-
86
-
87
-
88
-
89
-
90
-
91
-
92
-
93
-
94
-
95
-
96
-
97
-
98
-
99
-
100
-
101
-
102
-
103
-
104
-
105
-
106
-
107
-
108
-
109
-
110
-
111
-
112
-
113
-
114
-
115
-
116
-
117
-
118
-
119
-
120
-
121
-
122
-
123
-
124
-
125
-
126
-
127
-
128
-
129
-
130
-
131
-
132
-
133
-
134
-
135
-
136
-
137
-
138
-
139
-
140
-
141
-
142
-
143
-
144
-
145
-
146
-
147
-
148
-
149
-
150
-
151
-
152
-
153
-
154
-
155
-
156
-
157
-
158
-
159
-
160
-
161
-
162
-
163
-
164
-
165
-
166
-
167
-
168
-
169
-
170
-
171
-
172
-
173
-
174
-
175
-
176
-
177
-
178
-
179
-
180
-
181
-
182
-
183
-
184
-
185
-
186
-
187
-
188
-
189
-
190
-
191
-
192
-
193
-
194
-
195
-
196
 |
 |

36
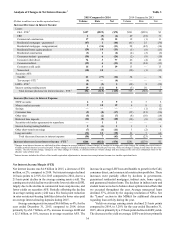
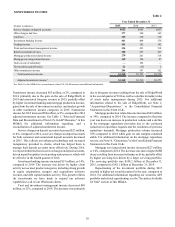
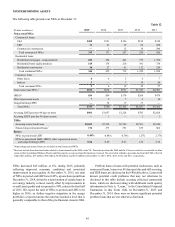
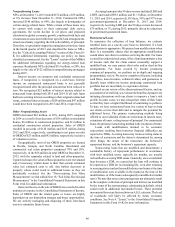
NONINTEREST INCOME
Table 4
Year Ended December 31
(Dollars in millions) 2015 2014 2013
Service charges on deposit accounts $622 $645 $657
Other charges and fees 377 368 369
Card fees 329 320 310
Investment banking income 461 404 356
Trading income 181 182 182
Trust and investment management income 334 423 518
Retail investment services 300 297 267
Mortgage production related income 270 201 314
Mortgage servicing related income 169 196 87
Gain on sale of subsidiary —105 —
Net securities gains/(losses) 21 (15) 2
Other noninterest income 204 197 152
Total noninterest income $3,268 $3,323 $3,214
Adjusted noninterest income 1 $3,268 $3,218 $3,277
1 See Table 1 in this MD&A for a reconcilement of non-U.S. GAAP measures and additional information.
Noninterest income decreased $55 million, or 2%, compared to
2014, primarily due to the gain on the sale of RidgeWorth in
2014 and associated foregone revenue in 2015, partially offset
by higher investment banking and mortgage production income,
gains from the sale of investment securities, and modest growth
in other noninterest income categories in 2015. Noninterest
income for 2015 increased $50 million, or 2%, compared to 2014
adjusted noninterest income. See Table 1, "Selected Financial
Data and Reconcilement of Non-U.S. GAAP Measures," in this
MD&A for additional information regarding, and a
reconciliation of, adjusted noninterest income.
Service charges on deposit accounts decreased $23 million,
or 4%, compared to 2014, as service charges on deposit accounts
for both consumer and commercial deposit accounts decreased
in 2015. This reflects our enhanced technology and increased
transparency provided to clients, which has helped them to
manage their deposit accounts more effectively. During 2016,
we expect further declines in service charges on deposit accounts,
driven in part by updates to our posting order process, which will
be effective in the fourth quarter of 2016.
Investment banking income increased $57 million, or 14%,
compared to 2014. The increase was driven by higher client
activity across most product categories, including strong growth
in equity originations, mergers and acquisitions advisory
revenue, and debt capital markets activity. This growth reflects
the investments we have made to expand our advisory
capabilities to all of our Wholesale clients.
Trust and investment management income decreased $89
million, or 21%, compared to 2014. The decrease was primarily
due to foregone revenue resulting from the sale of RidgeWorth
in the second quarter of 2014 as well as a decline in market value
of assets under management during 2015. For additional
information related to the sale of RidgeWorth, see Note 2,
"Acquisitions/Dispositions," to the Consolidated Financial
Statements in this Form 10-K.
Mortgage production related income increased $69 million,
or 34%, compared to 2014. The increase compared to the prior
year was due to an increase in production volume and a decline
in the mortgage repurchase provision due to the continued
reduction in repurchase requests and the resolution of previous
repurchase demands. Mortgage production volume increased
38% compared to 2014 while gain on sale margins remained
stable. For additional information on the mortgage repurchase
reserve, see Note 16, "Guarantees," to the Consolidated Financial
Statements in this Form 10-K.
Mortgage servicing related income decreased $27 million,
or 14%, compared to 2014. The decrease was due to higher MSR
decay resulting from increased refinance activity, partially offset
by higher servicing fees driven by a larger servicing portfolio.
The servicing portfolio was $148.2 billion at December 31,
2015, compared to $142.1 billion at December 31, 2014.
Repositioning of the investment portfolio during 2015
resulted in higher net securities gains for the year, compared to
2014. For additional information regarding our securities AFS
portfolio and related repositioning, see the "Securities Available
for Sale" section of this MD&A.