SunTrust 2015 Annual Report Download - page 71
Download and view the complete annual report
Please find page 71 of the 2015 SunTrust annual report below. You can navigate through the pages in the report by either clicking on the pages listed below, or by using the keyword search tool below to find specific information within the annual report.-
 1
1 -
2
-
3
-
4
-
5
-
6
-
7
-
8
-
9
-
10
-
11
-
12
-
13
-
14
-
15
-
16
-
17
-
18
-
19
-
20
-
21
-
22
-
23
-
24
-
25
-
26
-
27
-
28
-
29
-
30
-
31
-
32
-
33
-
34
-
35
-
36
-
37
-
38
-
39
-
40
-
41
-
42
-
43
-
44
-
45
-
46
-
47
-
48
-
49
-
50
-
51
-
52
-
53
-
54
-
55
-
56
-
57
-
58
-
59
-
60
-
 61
61 -
 62
62 -
 63
63 -
 64
64 -
 65
65 -
 66
66 -
 67
67 -
 68
68 -
 69
69 -
 70
70 -
 71
71 -
 72
72 -
 73
73 -
 74
74 -
 75
75 -
 76
76 -
 77
77 -
 78
78 -
 79
79 -
 80
80 -
 81
81 -
82
-
83
-
84
-
85
-
86
-
87
-
88
-
89
-
90
-
91
-
92
-
93
-
94
-
95
-
96
-
97
-
98
-
99
-
100
-
101
-
102
-
103
-
104
-
105
-
106
-
107
-
108
-
109
-
110
-
111
-
112
-
113
-
114
-
115
-
116
-
117
-
118
-
119
-
120
-
121
-
122
-
123
-
124
-
125
-
126
-
127
-
128
-
129
-
130
-
131
-
132
-
133
-
134
-
135
-
136
-
137
-
138
-
139
-
140
-
141
-
142
-
143
-
144
-
145
-
146
-
147
-
148
-
149
-
150
-
151
-
152
-
153
-
154
-
155
-
156
-
157
-
158
-
159
-
160
-
161
-
162
-
163
-
164
-
165
-
166
-
167
-
168
-
169
-
170
-
171
-
172
-
173
-
174
-
175
-
176
-
177
-
178
-
179
-
180
-
181
-
182
-
183
-
184
-
185
-
186
-
187
-
188
-
189
-
190
-
191
-
192
-
193
-
194
-
195
-
196
 |
 |

43
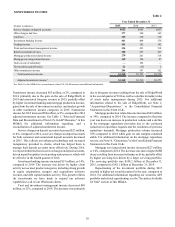
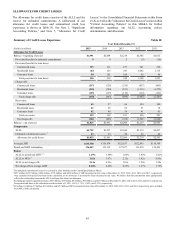
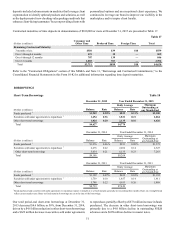
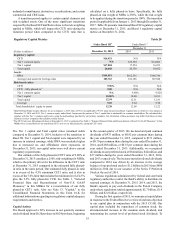
ALLOWANCE FOR CREDIT LOSSES
The allowance for credit losses consists of the ALLL and the
reserve for unfunded commitments. A rollforward of our
allowance for credit losses and summarized credit loss
experience is shown in Table 10. See Note 1, "Significant
Accounting Policies," and Note 7, "Allowance for Credit
Losses," to the Consolidated Financial Statements in this Form
10-K, as well as the "Allowance for Credit Losses" section within
"Critical Accounting Policies" in this MD&A for further
information regarding our ALLL accounting policy,
determination, and allocation.
Summary of Credit Losses Experience Table 10
Year Ended December 31
(Dollars in millions) 2015 2014 2013 2012 2011
Allowance for Credit Losses
Balance - beginning of period $1,991 $2,094 $2,219 $2,505 $3,032
Provision/(benefit) for unfunded commitments 94 5 (3) (10)
Provision/(benefit) for loan losses:
Commercial loans 133 111 197 241 324
Residential loans (67) 126 243 1,062 1,113
Consumer loans 90 101 108 95 86
Total provision for loan losses 156 338 548 1,398 1,523
Charge-offs:
Commercial loans (117) (128)(219)(457) (803)
Residential loans (218) (344)(531) (1,316) (1,275)
Consumer loans (135) (135)(119)(134) (163)
Total charge-offs (470) (607)(869) (1,907) (2,241)
Recoveries:
Commercial loans 45 57 66 154 140
Residential loans 42 65 87 31 18
Consumer loans 42 40 38 41 43
Total recoveries 129 162 191 226 201
Net charge-offs (341) (445)(678) (1,681) (2,040)
Balance - end of period $1,815 $1,991 $2,094 $2,219 $2,505
Components:
ALLL $1,752 $1,937 $2,044 $2,174 $2,457
Unfunded commitments reserve 163 54 50 45 48
Allowance for credit losses $1,815 $1,991 $2,094 $2,219 $2,505
Average LHFI $133,558 $130,874 $122,657 $122,893 $116,308
Period-end LHFI outstanding 136,442 133,112 127,877 121,470 122,495
Ratios:
ALLL to period-end LHFI 2, 3 1.29% 1.46% 1.60% 1.80% 2.01%
ALLL to NPLs 42.62x 3.07x 2.12x 1.42x 0.85x
ALLL to net charge-offs 5.14x 4.35x 3.01x 1.29x 1.20x
Net charge-offs to average LHFI 0.26% 0.34% 0.55% 1.37% 1.75%
1 The unfunded commitments reserve is recorded in other liabilities in the Consolidated Balance Sheets.
2 $257 million, $272 million, $302 million, $379 million, and $433 million of LHFI measured at fair value at December 31, 2015, 2014, 2013, 2012, and 2011, respectively,
were excluded from period-end loans in the calculation, as no allowance is recorded for loans measured at fair value. We believe that this presentation more appropriately
reflects the relationship between the ALLL and loans that attract an allowance.
3 Excluding government-guaranteed loans of $5.6 billion, $5.5 billion, $9.0 billion, $9.6 billion, and $13.9 billion at December 31, 2015, 2014, 2013, 2012, and 2011, respectively,
from period-end loans in the calculation results in ratios of 1.34%, 1.52%, 1.72%, 1.95%, and 2.27%, respectively.
4 $3 million, $3 million, $7 million, $19 million, and $25 million of NPLs measured at fair value at December 31, 2015, 2014, 2013, 2012, and 2011, respectively, were excluded
from NPLs in the calculation.