SunTrust 2015 Annual Report Download - page 120
Download and view the complete annual report
Please find page 120 of the 2015 SunTrust annual report below. You can navigate through the pages in the report by either clicking on the pages listed below, or by using the keyword search tool below to find specific information within the annual report.-
 1
1 -
2
-
3
-
4
-
5
-
6
-
7
-
8
-
9
-
10
-
11
-
12
-
13
-
14
-
15
-
16
-
17
-
18
-
19
-
20
-
21
-
22
-
23
-
24
-
25
-
26
-
27
-
28
-
29
-
30
-
31
-
32
-
33
-
34
-
35
-
36
-
37
-
38
-
39
-
40
-
41
-
42
-
43
-
44
-
45
-
46
-
47
-
48
-
49
-
50
-
51
-
52
-
53
-
54
-
55
-
56
-
57
-
58
-
59
-
60
-
61
-
62
-
63
-
64
-
65
-
66
-
67
-
68
-
69
-
70
-
71
-
72
-
73
-
74
-
75
-
76
-
77
-
78
-
79
-
80
-
81
-
82
-
83
-
84
-
85
-
86
-
87
-
88
-
89
-
90
-
91
-
92
-
93
-
94
-
95
-
96
-
97
-
98
-
99
-
100
-
101
-
102
-
103
-
104
-
105
-
106
-
107
-
108
-
109
-
 110
110 -
 111
111 -
 112
112 -
 113
113 -
 114
114 -
 115
115 -
 116
116 -
 117
117 -
 118
118 -
 119
119 -
 120
120 -
 121
121 -
 122
122 -
 123
123 -
 124
124 -
 125
125 -
 126
126 -
 127
127 -
 128
128 -
 129
129 -
 130
130 -
131
-
132
-
133
-
134
-
135
-
136
-
137
-
138
-
139
-
140
-
141
-
142
-
143
-
144
-
145
-
146
-
147
-
148
-
149
-
150
-
151
-
152
-
153
-
154
-
155
-
156
-
157
-
158
-
159
-
160
-
161
-
162
-
163
-
164
-
165
-
166
-
167
-
168
-
169
-
170
-
171
-
172
-
173
-
174
-
175
-
176
-
177
-
178
-
179
-
180
-
181
-
182
-
183
-
184
-
185
-
186
-
187
-
188
-
189
-
190
-
191
-
192
-
193
-
194
-
195
-
196
 |
 |

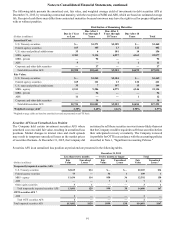
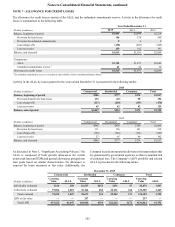
Notes to Consolidated Financial Statements, continued
92
December 31, 2014
Less than twelve months Twelve months or longer Total
(Dollars in millions)
Fair
Value
Unrealized
Losses 2Fair
Value
Unrealized
Losses 2Fair
Value
Unrealized
Losses 2
Temporarily impaired securities AFS:
U.S. Treasury securities $150 $1 $— $— $150 $1
Federal agency securities 20 — 132 2 152 2
MBS - agency 2,347 6 4,911 77 7,258 83
ABS — — 14 — 14 —
Total temporarily impaired securities AFS 2,517 7 5,057 79 7,574 86
OTTI securities AFS 1:
MBS - private 69 1 — — 69 1
Total OTTI securities AFS 69 1 — — 69 1
Total impaired securities AFS $2,586 $8 $5,057 $79 $7,643 $87
1 OTTI securities for which credit losses have been recorded in earnings in current and/or prior periods.
2 Unrealized losses less than $0.5 million are presented as zero within the table.
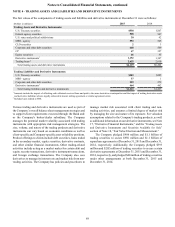
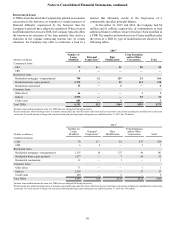
At December 31, 2015, temporarily impaired securities AFS that
have been in an unrealized loss position for twelve months or
longer included agency MBS, federal agency securities, and one
ABS collateralized by 2004 vintage home equity loans.
Unrealized losses on these temporarily impaired agency MBS
and federal agency securities were due to market interest rates
being higher than the securities' stated coupon rates. The
temporarily impaired ABS continues to receive timely principal
and interest payments, and is evaluated quarterly for credit
impairment. Unrealized losses on securities AFS that relate to
factors other than credit are recorded in AOCI, net of tax.
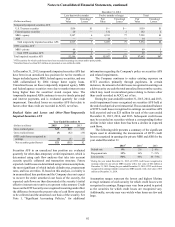
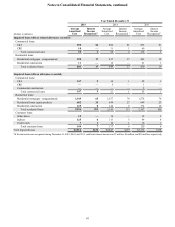
Realized Gains and Losses and Other-Than-Temporarily
Impaired Securities AFS
Year Ended December 31
(Dollars in millions) 2015 2014 2013
Gross realized gains $25 $28 $39
Gross realized losses (3) (42) (36)
OTTI credit losses recognized in
earnings (1) (1) (1)
Net securities gains/(losses) $21 ($15) $2
Securities AFS in an unrealized loss position are evaluated
quarterly for other-than-temporary credit impairment, which is
determined using cash flow analyses that take into account
security specific collateral and transaction structure. Future
expected credit losses are determined using various assumptions,
the most significant of which include default rates, prepayment
rates, and loss severities. If, based on this analysis, a security is
in an unrealized loss position and the Company does not expect
to recover the entire amortized cost basis of the security, the
expected cash flows are then discounted at the security’s initial
effective interest rate to arrive at a present value amount. Credit
losses on the OTTI security are recognized in earnings and reflect
the difference between the present value of cash flows expected
to be collected and the amortized cost basis of the security. See
Note 1, "Significant Accounting Policies," for additional
information regarding the Company's policy on securities AFS
and related impairments.
The Company continues to reduce existing exposure on
OTTI securities primarily through paydowns. In certain
instances, the amount of credit losses recognized in earnings on
a debt security exceeds the total unrealized losses on the security,
which may result in unrealized gains relating to factors other
than credit recorded in AOCI, net of tax.
During the years ended December 31, 2015, 2014, and 2013,
credit impairment losses recognized on securities AFS held at
the end of each period were immaterial. The accumulated balance
of OTTI credit losses recognized in earnings on securities AFS
held at period end was $25 million for each of the years ended
December 31, 2015, 2014, and 2013. Subsequent credit losses
may be recorded on securities without a corresponding further
decline in fair value when there has been a decline in expected
cash flows.
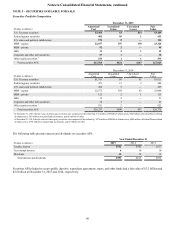
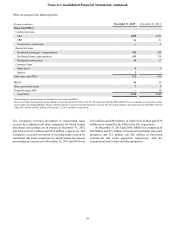
The following table presents a summary of the significant
inputs used in determining the measurement of OTTI credit
losses recognized in earnings for private MBS and ABS for the
year ended December 31:
2015 12014 12013
Default rate 9% 2% 2 - 9%
Prepayment rate 13% 16% 7 - 21%
Loss severity 56% 46% 46 - 74%
1 During the year ended December 31, 2015, all OTTI credit losses recognized in
earnings related to one private MBS security with a fair value of $20 million at
December 31, 2015. During the year ended December 31, 2014, OTTI credit losses
recognized in earnings related to one private MBS security with a fair value of $16
million at December 31, 2014.
Assumption ranges represent the lowest and highest lifetime
average estimates of each security for which credit losses were
recognized in earnings. Ranges may vary from period to period
as the securities for which credit losses are recognized vary.
Additionally, severity may vary widely when losses are few and
large.