SunTrust 2015 Annual Report Download - page 118
Download and view the complete annual report
Please find page 118 of the 2015 SunTrust annual report below. You can navigate through the pages in the report by either clicking on the pages listed below, or by using the keyword search tool below to find specific information within the annual report.-
 1
1 -
2
-
3
-
4
-
5
-
6
-
7
-
8
-
9
-
10
-
11
-
12
-
13
-
14
-
15
-
16
-
17
-
18
-
19
-
20
-
21
-
22
-
23
-
24
-
25
-
26
-
27
-
28
-
29
-
30
-
31
-
32
-
33
-
34
-
35
-
36
-
37
-
38
-
39
-
40
-
41
-
42
-
43
-
44
-
45
-
46
-
47
-
48
-
49
-
50
-
51
-
52
-
53
-
54
-
55
-
56
-
57
-
58
-
59
-
60
-
61
-
62
-
63
-
64
-
65
-
66
-
67
-
68
-
69
-
70
-
71
-
72
-
73
-
74
-
75
-
76
-
77
-
78
-
79
-
80
-
81
-
82
-
83
-
84
-
85
-
86
-
87
-
88
-
89
-
90
-
91
-
92
-
93
-
94
-
95
-
96
-
97
-
98
-
99
-
100
-
101
-
102
-
103
-
104
-
105
-
106
-
107
-
 108
108 -
 109
109 -
 110
110 -
 111
111 -
 112
112 -
 113
113 -
 114
114 -
 115
115 -
 116
116 -
 117
117 -
 118
118 -
 119
119 -
 120
120 -
 121
121 -
 122
122 -
 123
123 -
 124
124 -
 125
125 -
 126
126 -
 127
127 -
 128
128 -
129
-
130
-
131
-
132
-
133
-
134
-
135
-
136
-
137
-
138
-
139
-
140
-
141
-
142
-
143
-
144
-
145
-
146
-
147
-
148
-
149
-
150
-
151
-
152
-
153
-
154
-
155
-
156
-
157
-
158
-
159
-
160
-
161
-
162
-
163
-
164
-
165
-
166
-
167
-
168
-
169
-
170
-
171
-
172
-
173
-
174
-
175
-
176
-
177
-
178
-
179
-
180
-
181
-
182
-
183
-
184
-
185
-
186
-
187
-
188
-
189
-
190
-
191
-
192
-
193
-
194
-
195
-
196
 |
 |

Notes to Consolidated Financial Statements, continued
90
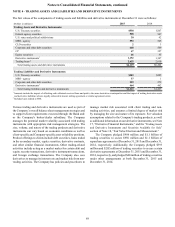
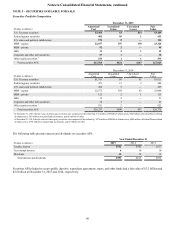
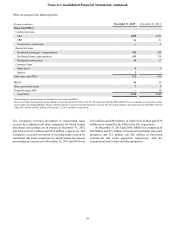
NOTE 5 – SECURITIES AVAILABLE FOR SALE
Securities Portfolio Composition
December 31, 2015
(Dollars in millions)
Amortized
Cost
Unrealized
Gains
Unrealized
Losses
Fair
Value
U.S. Treasury securities $3,460 $3 $14 $3,449
Federal agency securities 402 10 1 411
U.S. states and political subdivisions 156 8 — 164
MBS - agency 22,877 397 150 23,124
MBS - private 92 2 — 94
ABS 11 2 1 12
Corporate and other debt securities 37 1 — 38
Other equity securities 1533 1 1 533
Total securities AFS $27,568 $424 $167 $27,825
December 31, 2014
(Dollars in millions) Amortized
Cost
Unrealized
Gains
Unrealized
Losses
Fair
Value
U.S. Treasury securities $1,913 $9 $1 $1,921
Federal agency securities 471 15 2 484
U.S. states and political subdivisions 200 9 — 209
MBS - agency 22,573 558 83 23,048
MBS - private 122 2 1 123
ABS 19 2 — 21
Corporate and other debt securities 38 3 — 41
Other equity securities 1921 2 — 923
Total securities AFS $26,257 $600 $87 $26,770
1 At December 31, 2015, the fair value of other equity securities was comprised of the following: $32 million of FHLB of Atlanta stock, $402 million of Federal Reserve Bank
of Atlanta stock, $93 million of mutual fund investments, and $6 million of other.
At December 31, 2014, the fair value of other equity securities was comprised of the following: $376 million of FHLB of Atlanta stock, $402 million of Federal Reserve Bank
of Atlanta stock, $138 million of mutual fund investments, and $7 million of other.
The following table presents interest and dividends on securities AFS:
Year Ended December 31
(Dollars in millions) 2015 2014 2013
Taxable interest $552 $565 $537
Tax-exempt interest 610 10
Dividends 35 38 32
Total interest and dividends $593 $613 $579
Securities AFS pledged to secure public deposits, repurchase agreements, trusts, and other funds had a fair value of $3.2 billion and
$2.6 billion at December 31, 2015 and 2014, respectively.