SunTrust 2015 Annual Report Download - page 75
Download and view the complete annual report
Please find page 75 of the 2015 SunTrust annual report below. You can navigate through the pages in the report by either clicking on the pages listed below, or by using the keyword search tool below to find specific information within the annual report.-
 1
1 -
2
-
3
-
4
-
5
-
6
-
7
-
8
-
9
-
10
-
11
-
12
-
13
-
14
-
15
-
16
-
17
-
18
-
19
-
20
-
21
-
22
-
23
-
24
-
25
-
26
-
27
-
28
-
29
-
30
-
31
-
32
-
33
-
34
-
35
-
36
-
37
-
38
-
39
-
40
-
41
-
42
-
43
-
44
-
45
-
46
-
47
-
48
-
49
-
50
-
51
-
52
-
53
-
54
-
55
-
56
-
57
-
58
-
59
-
60
-
61
-
62
-
63
-
64
-
 65
65 -
 66
66 -
 67
67 -
 68
68 -
 69
69 -
 70
70 -
 71
71 -
 72
72 -
 73
73 -
 74
74 -
 75
75 -
 76
76 -
 77
77 -
 78
78 -
 79
79 -
 80
80 -
 81
81 -
 82
82 -
 83
83 -
 84
84 -
 85
85 -
86
-
87
-
88
-
89
-
90
-
91
-
92
-
93
-
94
-
95
-
96
-
97
-
98
-
99
-
100
-
101
-
102
-
103
-
104
-
105
-
106
-
107
-
108
-
109
-
110
-
111
-
112
-
113
-
114
-
115
-
116
-
117
-
118
-
119
-
120
-
121
-
122
-
123
-
124
-
125
-
126
-
127
-
128
-
129
-
130
-
131
-
132
-
133
-
134
-
135
-
136
-
137
-
138
-
139
-
140
-
141
-
142
-
143
-
144
-
145
-
146
-
147
-
148
-
149
-
150
-
151
-
152
-
153
-
154
-
155
-
156
-
157
-
158
-
159
-
160
-
161
-
162
-
163
-
164
-
165
-
166
-
167
-
168
-
169
-
170
-
171
-
172
-
173
-
174
-
175
-
176
-
177
-
178
-
179
-
180
-
181
-
182
-
183
-
184
-
185
-
186
-
187
-
188
-
189
-
190
-
191
-
192
-
193
-
194
-
195
-
196
 |
 |
47
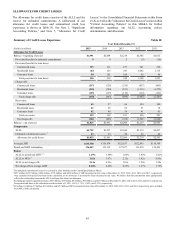
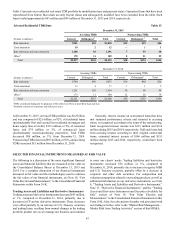
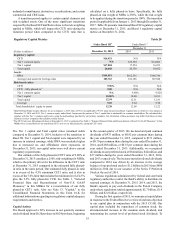
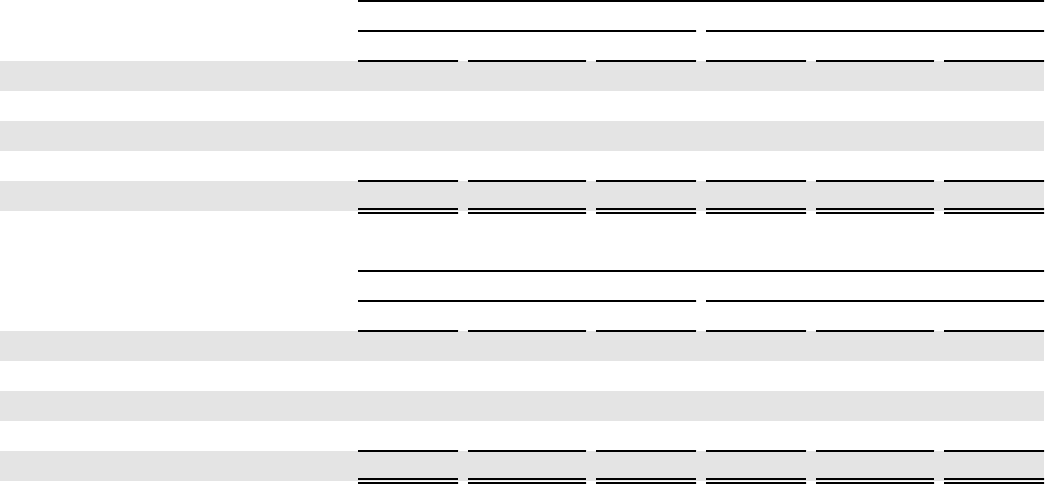
Table 13 presents our residential real estate TDR portfolio by modification type and payment status. Guaranteed loans that have been
repurchased from Ginnie Mae under an early buyout clause and subsequently modified have been excluded from the table. Such
loans totaled approximately $61 million and $49 million at December 31, 2015 and 2014, respectively.
Selected Residential TDR Data Table 13
December 31, 2015
Accruing TDRs Nonaccruing TDRs
(Dollars in millions) Current Delinquent 1Total Current Delinquent 1Total
Rate reduction $961 $69 $1,030 $15 $39 $54
Term extension 10 2 12 — 1 1
Rate reduction and term extension 1,108 83 1,191 7 53 60
Other 2178 11 189 8 21 29
Total $2,257 $165 $2,422 $30 $114 $144
December 31, 2014
Accruing TDRs Nonaccruing TDRs
(Dollars in millions) Current Delinquent 1 Total Current Delinquent 1 Total
Rate reduction $784 $69 $853 $16 $40 $56
Term extension 13 4 17 1 1 2
Rate reduction and term extension 1,251 103 1,354 30 68 98
Other 2173 11 184 12 26 38
Total $2,221 $187 $2,408 $59 $135 $194
1 TDRs considered delinquent for purposes of this table were those at least thirty days past due.
2 Primarily consists of extensions and deficiency notes.
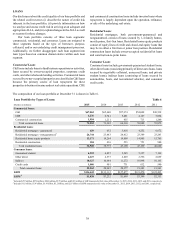
At December 31, 2015, our total TDR portfolio was $2.8 billion
and was composed of $2.6 billion, or 92%, of residential loans
(predominantly first and second lien residential mortgages and
home equity lines of credit), $131 million, or 5%, of consumer
loans, and $74 million, or 3%, of commercial loans
(predominantly income-producing properties). Total TDRs
decreased $86 million, or 3%, from December 31, 2014.
Nonaccruing TDRs decreased $97 million, or 36%, and accruing
TDRs increased $11 million from December 31, 2014.
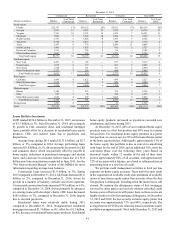
Generally, interest income on restructured loans that have
met sustained performance criteria and returned to accruing
status, is recognized according to the terms of the restructuring.
Such recognized interest income was $115 million and $118
million during 2015 and 2014, respectively. If all such loans had
been accruing interest according to their original contractual
terms, estimated interest income of $146 million and $153
million during 2015 and 2014, respectively, would have been
recognized.
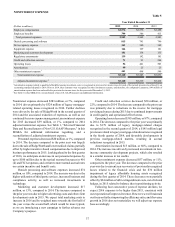
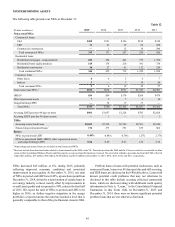
SELECTED FINANCIAL INSTRUMENTS MEASURED AT FAIR VALUE
The following is a discussion of the more significant financial
assets and financial liabilities that are measured at fair value on
the Consolidated Balance Sheets at December 31, 2015 and
2014. For a complete discussion of our financial instruments
measured at fair value and the methodologies used to estimate
the fair values of our financial instruments, see Note 18, “Fair
Value Election and Measurement,” to the Consolidated Financial
Statements in this Form 10-K.
Trading Assets and Liabilities and Derivative Instruments
Trading assets and derivative instruments decreased $83 million,
or 1%, compared to December 31, 2014, primarily due to
decreases in CP and net derivative instruments. These decreases
were offset partially by an increase in U.S. Treasury securities
and trading loans, resulting from normal changes in the trading
portfolio product mix as we manage our business and continue
to meet our clients' needs. Trading liabilities and derivative
instruments increased $36 million, or 3%, compared to
December 31, 2014, primarily due to increases in agency MBS
and U.S. Treasury securities, partially offset by a decrease in
corporate and other debt securities. For composition and
valuation assumptions related to our trading products, as well as
additional information on our derivative instruments, see Note
4, “Trading Assets and Liabilities and Derivative Instruments,”
Note 17, “Derivative Financial Instruments,” and the “Trading
Assets and Derivative Instruments and Securities Available for
Sale” section of Note 18, “Fair Value Election and
Measurement,” to the Consolidated Financial Statements in this
Form 10-K. Also, for a discussion of market risk associated with
our trading activities, refer to the “Market Risk Management—
Market Risk from Trading Activities” section of this MD&A.