SunTrust 2015 Annual Report Download - page 97
Download and view the complete annual report
Please find page 97 of the 2015 SunTrust annual report below. You can navigate through the pages in the report by either clicking on the pages listed below, or by using the keyword search tool below to find specific information within the annual report.-
 1
1 -
2
-
3
-
4
-
5
-
6
-
7
-
8
-
9
-
10
-
11
-
12
-
13
-
14
-
15
-
16
-
17
-
18
-
19
-
20
-
21
-
22
-
23
-
24
-
25
-
26
-
27
-
28
-
29
-
30
-
31
-
32
-
33
-
34
-
35
-
36
-
37
-
38
-
39
-
40
-
41
-
42
-
43
-
44
-
45
-
46
-
47
-
48
-
49
-
50
-
51
-
52
-
53
-
54
-
55
-
56
-
57
-
58
-
59
-
60
-
61
-
62
-
63
-
64
-
65
-
66
-
67
-
68
-
69
-
70
-
71
-
72
-
73
-
74
-
75
-
76
-
77
-
78
-
79
-
80
-
81
-
82
-
83
-
84
-
85
-
86
-
 87
87 -
 88
88 -
 89
89 -
 90
90 -
 91
91 -
 92
92 -
 93
93 -
 94
94 -
 95
95 -
 96
96 -
 97
97 -
 98
98 -
 99
99 -
 100
100 -
 101
101 -
 102
102 -
 103
103 -
 104
104 -
 105
105 -
 106
106 -
 107
107 -
108
-
109
-
110
-
111
-
112
-
113
-
114
-
115
-
116
-
117
-
118
-
119
-
120
-
121
-
122
-
123
-
124
-
125
-
126
-
127
-
128
-
129
-
130
-
131
-
132
-
133
-
134
-
135
-
136
-
137
-
138
-
139
-
140
-
141
-
142
-
143
-
144
-
145
-
146
-
147
-
148
-
149
-
150
-
151
-
152
-
153
-
154
-
155
-
156
-
157
-
158
-
159
-
160
-
161
-
162
-
163
-
164
-
165
-
166
-
167
-
168
-
169
-
170
-
171
-
172
-
173
-
174
-
175
-
176
-
177
-
178
-
179
-
180
-
181
-
182
-
183
-
184
-
185
-
186
-
187
-
188
-
189
-
190
-
191
-
192
-
193
-
194
-
195
-
196
 |
 |
69
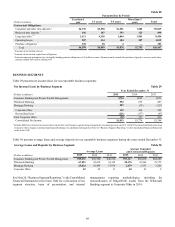
BUSINESS SEGMENT RESULTS
Year Ended December 31, 2015 vs. 2014
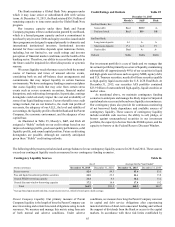
Consumer Banking and Private Wealth Management
Consumer Banking and Private Wealth Management reported
net income of $754 million for the year ended December 31,
2015, an increase of $59 million, or 8%, compared to 2014. The
increase in net income was driven primarily by an increase in
net interest income and lower provision for credit losses.
Net interest income was $2.7 billion, an increase of $100
million, or 4%, compared to 2014, primarily driven by growth
in average deposit balances and improved loan spreads, partially
offset by lower deposit spreads and a decline in average loan
balances. Net interest income related to deposits increased $58
million, or 3%, driven by a $5.1 billion, or 6%, increase in
average deposit balances. Favorable deposit mix trends
continued as average deposit balances increased in all lower cost
product categories, offsetting a $1.4 billion, or 13%, decline in
average time deposits, contributing to a two basis point decline
in the overall rate paid on average deposits. Net interest income
related to loans increased $27 million, or 3%, driven by an overall
13 basis point increase in loan spreads, partially offset by a $1.1
billion, or 3%, decrease in average loan balances. Declines in
student and indirect auto loans were driven by portfolio sales
and the securitization of indirect auto loans in 2015, in addition
to home equity and consumer mortgage loan attrition. These
decreases were partially offset by growth primarily within the
consumer direct loans, personal credit lines, and credit cards
categories.
Provision for credit losses was $137 million, a decrease of
$54 million, or 28%, compared to 2014. The decrease was largely
driven by lower net charge-offs related to continued strong asset
quality.
Total noninterest income was $1.5 billion, a decrease of $19
million, or 1%, compared to 2014. The decrease was largely
driven by declines in service charges on deposits (due to changes
in client behavior) and lower trust and investment management
income (due to a decline in assets under management), partially
offset by higher card fee income. Additionally, gains on loan
portfolio sales were higher in 2015 compared to 2014.
Total noninterest expense was $2.9 billion, an increase of
$36 million, or 1%, compared to 2014. The increase was driven
by higher outside data processing expenses resulting from
increased transaction volumes and higher utilization of outside
vendors. Additionally, increases in various corporate support
expenses, such as marketing and technology, were partially offset
by decreases in staff expenses and operating losses.
Wholesale Banking
Wholesale Banking reported net income of $954 million for the
year ended December 31, 2015, an increase of $79 million, or
9%, compared to 2014. The increase in net income was
attributable to increases in net interest income and noninterest
income, partially offset by an increase in the provision for credit
losses and noninterest expense.
Net interest income was $1.9 billion, an increase of $111
million, or 6%, compared to 2014, driven by increases in average
loan and deposit balances, partially offset by lower loan and
deposit spreads. Net interest income related to loans increased,
as average loan balances grew $5.2 billion, or 8%, led by growth
in C&I, CRE, and tax-exempt loans. Net interest income related
to client deposits increased as average deposit balances grew
$6.8 billion, or 16%, compared to 2014. Lower cost average
demand deposits increased $415 million, or 2%, and average
combined interest-bearing transaction and money market
accounts increased $6.6 billion, or 32%, while average CD
balances declined approximately $169 million. Enhancements
we made to our treasury and payment products, in conjunction
with our client liquidity specialists, contributed to our deposit
growth momentum.
Provision for credit losses was $137 million, an increase of
$66 million, compared to 2014. The increase reflects loan growth
and higher reserves related to energy exposures.
Total noninterest income was $1.2 billion, an increase of
$111 million, or 10%, compared to 2014. The increase was
primarily driven by a $57 million, or 14%, increase in investment
banking income and an increase in leasing-related revenue
attributable to impairment charges on aircraft leases recognized
in 2014. These increases were partially offset by declines in
trading revenues, letter of credit fees, net service charges on
treasury related services, and other income.
Total noninterest expense was $1.6 billion, an increase of
$23 million, or 1%, compared to 2014. The increase was
primarily due to increases in employee compensation as we
continue to invest in talent to meet our clients' needs and augment
our capabilities, expense tied to new market tax credit
investments, and outside processing expenses. These increases
were partially offset by lower impairment charges due to our
strategic, first quarter of 2014 decision to sell certain legacy
investments of the aforementioned affordable housing
partnership assets. The sale of these investments resulted in an
impairment charge in 2014, as well as a decline in associated
partnership expenses due to the subsequent sale of those assets.
Mortgage Banking
Mortgage Banking reported net income was $287 million for the
year ended December 31, 2015, compared to a net loss of $53
million in 2014. Excluding the 2014 after-tax impact of Form 8-
K and other legacy mortgage-related items presented in Table 1,
"Selected Financial Data and Reconcilement of Non-U.S. GAAP
Measures," the increase in net income was driven by declines in
the provision for credit losses and noninterest expense, partially
offset by lower net interest income.
Net interest income was $483 million, a decrease of $69
million, or 13%, compared to 2014. The decrease was
predominantly due to lower net interest income on loans and
LHFS. Net interest income on loans decreased $58 million, or
14%, due to a $1.5 billion, or 6%, decrease in average loan
balances and lower spreads on residential mortgages. The decline
in average loans was largely driven by the sale of government-
guaranteed residential loans in the second and third quarters of
2014. Additionally, net interest income on LHFS decreased $6
million primarily due to lower spreads.
Provision for credit losses was a benefit of $110 million,
resulting in a decrease of $191 million compared to 2014. The
improvement was primarily attributable to continued
improvement in asset quality.