SunTrust 2015 Annual Report Download - page 90
Download and view the complete annual report
Please find page 90 of the 2015 SunTrust annual report below. You can navigate through the pages in the report by either clicking on the pages listed below, or by using the keyword search tool below to find specific information within the annual report.-
 1
1 -
2
-
3
-
4
-
5
-
6
-
7
-
8
-
9
-
10
-
11
-
12
-
13
-
14
-
15
-
16
-
17
-
18
-
19
-
20
-
21
-
22
-
23
-
24
-
25
-
26
-
27
-
28
-
29
-
30
-
31
-
32
-
33
-
34
-
35
-
36
-
37
-
38
-
39
-
40
-
41
-
42
-
43
-
44
-
45
-
46
-
47
-
48
-
49
-
50
-
51
-
52
-
53
-
54
-
55
-
56
-
57
-
58
-
59
-
60
-
61
-
62
-
63
-
64
-
65
-
66
-
67
-
68
-
69
-
70
-
71
-
72
-
73
-
74
-
75
-
76
-
77
-
78
-
79
-
 80
80 -
 81
81 -
 82
82 -
 83
83 -
 84
84 -
 85
85 -
 86
86 -
 87
87 -
 88
88 -
 89
89 -
 90
90 -
 91
91 -
 92
92 -
 93
93 -
 94
94 -
 95
95 -
 96
96 -
 97
97 -
 98
98 -
 99
99 -
 100
100 -
101
-
102
-
103
-
104
-
105
-
106
-
107
-
108
-
109
-
110
-
111
-
112
-
113
-
114
-
115
-
116
-
117
-
118
-
119
-
120
-
121
-
122
-
123
-
124
-
125
-
126
-
127
-
128
-
129
-
130
-
131
-
132
-
133
-
134
-
135
-
136
-
137
-
138
-
139
-
140
-
141
-
142
-
143
-
144
-
145
-
146
-
147
-
148
-
149
-
150
-
151
-
152
-
153
-
154
-
155
-
156
-
157
-
158
-
159
-
160
-
161
-
162
-
163
-
164
-
165
-
166
-
167
-
168
-
169
-
170
-
171
-
172
-
173
-
174
-
175
-
176
-
177
-
178
-
179
-
180
-
181
-
182
-
183
-
184
-
185
-
186
-
187
-
188
-
189
-
190
-
191
-
192
-
193
-
194
-
195
-
196
 |
 |

62
and the aggregate portfolio level on a daily basis to ensure risk
exposures are in line with our risk appetite. Our risk measurement
for covered positions takes into account trading exposures
resulting from interest rate risk, equity risk, foreign exchange
rate risk, credit spread risk, and commodity price risk.
For trading portfolios, VAR measures the estimated
maximum loss from a trading position, given a specified
confidence level and time horizon. VAR results are monitored
daily against established limits for each trading portfolio. For
risk management purposes, our VAR calculation is based on a
historical simulation and measures the potential trading losses
using a one-day holding period at a one-tail, 99% confidence
level. This means that, on average, trading losses are expected
to exceed VAR one out of 100 trading days or two to three times
per year. While VAR can be a useful risk management tool, it
does have inherent limitations, including the assumption that past
market behavior is indicative of future market performance. As
such, VAR is only one of several tools used to manage market
risk. Other tools used to actively manage market risk include
scenario analysis, stress testing, profit and loss attribution, and
stop loss limits.
In addition to VAR, in accordance with the Market Risk Rule
issued by the U.S. banking regulators, we also calculate Stressed
VAR, which is used as a component of the total market risk-
based capital charge. We calculate the Stressed VAR risk measure
using a ten-day holding period at a one-tail, 99% confidence level
and employ a historical simulation approach based on a
continuous twelve-month historical window. This window spans
from 2008-2009 and reflects a period of significant financial
stress to our portfolio. As such, our Stressed VAR calculation
uses the same methodology and models as regular VAR, which
is a requirement under the Market Risk Rule.
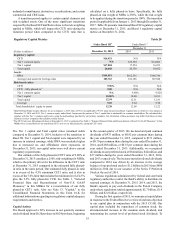
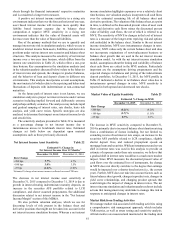
Table 24 presents VAR and Stressed VAR for the years ended
December 31, as well as VAR by Risk Factor at December 31,
2015 and 2014.
Value at Risk Profile Table 24
Year Ended December 31
(Dollars in millions) 2015 2014
VAR (1-day holding period):
Period end $3 $1
High 43
Low 21
Average 32
Stressed VAR (10-day holding period):
Period end $23 $41
High 104 83
Low 19 18
Average 51 43
(Dollars in millions)
December 31,
2015
December 31,
2014
VAR by Risk Factor (1-day holding period):
Equity risk $2 $1
Interest rate risk 31
Credit spread risk 21
VAR total (1-day diversified) 3 1
The trading portfolio, measured in terms of VAR, is
predominantly comprised of four material sub-portfolios of
covered positions: Credit trading, fixed income securities,
interest rate derivatives, and equity derivatives. The trading
portfolio also contains other sub-portfolios, including foreign
exchange; however, these trading risk exposures are not material.
All of our covered positions primarily emanate from
underwriting, market making and associated risk mitigating
hedging activity, and services for our clients. As illustrated in
Table 24, both average daily VAR for the year ended December
31, 2015 and period end VAR at December 31, 2015 increased
compared to the same periods in the prior year. These VAR
increases were driven largely by higher levels of volatility in the
market during 2015 compared to 2014. Average Stressed VAR
was higher in 2015 compared to the prior year, also due largely
to higher levels of volatility in the markets. However, risk
mitigating activities along with balance sheet optimization
efforts within our equity derivatives and credit trading businesses
during the second half of 2015 contributed toward a lower period
end Stressed VAR at December 31, 2015 compared to
December 31, 2014. The trading portfolio of covered positions
did not contain any correlation trading positions or on- or off-
balance sheet securitization positions in 2015 or 2014.
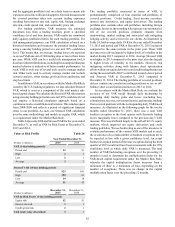
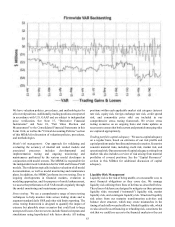
In accordance with the Market Risk Rule, we evaluate the
accuracy of our VAR model through daily backtesting by
comparing daily trading gains and losses (excluding fees,
commissions, reserves, net interest income, and intraday trading)
from covered positions with the corresponding daily VAR-based
measures. As illustrated in the following graph for the twelve
months ended December 31, 2015, there was a near VAR
backtest exception in the third quarter with firmwide trading
losses marginally lower compared to the previous day’s VAR
measure. This was attributed largely to the sell-off in U.S. equity
markets, which impacted our equity derivatives and credit
trading portfolios. We use backtesting as one of the measures to
evaluate performance of the various VAR models and as such,
the occurrence of a certain number of backtest exceptions are to
be expected in line with a given confidence level. An actual
backtest exception instead of the near exception during the third
quarter of 2015 would not have been inconsistent with the 99%
confidence level at which daily VAR is measured. The total
number of VAR backtesting exceptions over the preceding 12
months is used to determine the multiplication factor for the
VAR-based capital requirement under the Market Risk Rule,
whereby the capital multiplication factor increases from a
minimum of three to a maximum of four, depending on the
number of exceptions. There was no change in the capital
multiplication factor over the preceding 12 months.