SunTrust 2015 Annual Report Download - page 153
Download and view the complete annual report
Please find page 153 of the 2015 SunTrust annual report below. You can navigate through the pages in the report by either clicking on the pages listed below, or by using the keyword search tool below to find specific information within the annual report.-
 1
1 -
2
-
3
-
4
-
5
-
6
-
7
-
8
-
9
-
10
-
11
-
12
-
13
-
14
-
15
-
16
-
17
-
18
-
19
-
20
-
21
-
22
-
23
-
24
-
25
-
26
-
27
-
28
-
29
-
30
-
31
-
32
-
33
-
34
-
35
-
36
-
37
-
38
-
39
-
40
-
41
-
42
-
43
-
44
-
45
-
46
-
47
-
48
-
49
-
50
-
51
-
52
-
53
-
54
-
55
-
56
-
57
-
58
-
59
-
60
-
61
-
62
-
63
-
64
-
65
-
66
-
67
-
68
-
69
-
70
-
71
-
72
-
73
-
74
-
75
-
76
-
77
-
78
-
79
-
80
-
81
-
82
-
83
-
84
-
85
-
86
-
87
-
88
-
89
-
90
-
91
-
92
-
93
-
94
-
95
-
96
-
97
-
98
-
99
-
100
-
101
-
102
-
103
-
104
-
105
-
106
-
107
-
108
-
109
-
110
-
111
-
112
-
113
-
114
-
115
-
116
-
117
-
118
-
119
-
120
-
121
-
122
-
123
-
124
-
125
-
126
-
127
-
128
-
129
-
130
-
131
-
132
-
133
-
134
-
135
-
136
-
137
-
138
-
139
-
140
-
141
-
142
-
 143
143 -
 144
144 -
 145
145 -
 146
146 -
 147
147 -
 148
148 -
 149
149 -
 150
150 -
 151
151 -
 152
152 -
 153
153 -
 154
154 -
 155
155 -
 156
156 -
 157
157 -
 158
158 -
 159
159 -
 160
160 -
 161
161 -
 162
162 -
 163
163 -
164
-
165
-
166
-
167
-
168
-
169
-
170
-
171
-
172
-
173
-
174
-
175
-
176
-
177
-
178
-
179
-
180
-
181
-
182
-
183
-
184
-
185
-
186
-
187
-
188
-
189
-
190
-
191
-
192
-
193
-
194
-
195
-
196
 |
 |
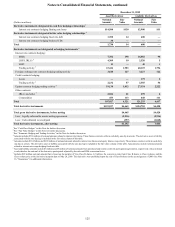
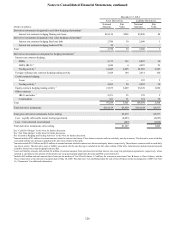
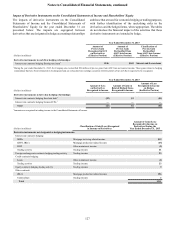
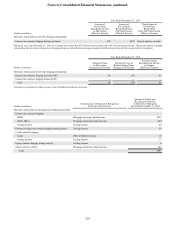
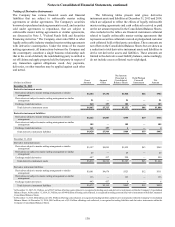
Notes to Consolidated Financial Statements, continued
125
December 31, 2015
Asset Derivatives Liability Derivatives
(Dollars in millions)
Notional
Amounts
Fair
Value
Notional
Amounts
Fair
Value
Derivative instruments designated in cash flow hedging relationships 1
Interest rate contracts hedging floating rate loans $14,500 $130 $2,900 $11
Derivative instruments designated in fair value hedging relationships 2
Interest rate contracts hedging fixed rate debt 1,700 14 600 —
Interest rate contracts hedging brokered CDs 30 — — —
Total 1,730 14 600 —
Derivative instruments not designated as hedging instruments 3
Interest rate contracts hedging:
MSRs 7,782 198 16,882 98
LHFS, IRLCs 44,309 10 2,520 5
LHFI 15 — 40 1
Trading activity 567,426 1,983 68,125 1,796
Foreign exchange rate contracts hedging trading activity 3,648 127 3,227 122
Credit contracts hedging:
Loans — — 175 2
Trading activity 62,232 57 2,385 54
Equity contracts hedging trading activity 519,138 1,812 27,154 2,222
Other contracts:
IRLCs and other 72,024 21 299 6
Commodities 453 113 448 111
Total 107,027 4,321 121,255 4,417
Total derivative instruments $123,257 $4,465 $124,755 $4,428
Total gross derivative instruments, before netting $4,465 $4,428
Less: Legally enforceable master netting agreements (2,916) (2,916)
Less: Cash collateral received/paid (397) (1,048)
Total derivative instruments, after netting $1,152 $464
1 See “Cash Flow Hedges” in this Note for further discussion.
2 See “Fair Value Hedges” in this Note for further discussion.
3 See “Economic Hedging and Trading Activities” in this Note for further discussion.
4 Amount includes $518 million of notional amounts related to interest rate futures. These futures contracts settle in cash daily, one day in arrears. The derivative asset or liability
associated with the one day lag is included in the fair value column of this table.
5 Amounts include $12.6 billion and $329 million of notional amounts related to interest rate futures and equity futures, respectively. These futures contracts settle in cash daily,
one day in arrears. The derivative asset or liability associated with the one day lag is included in the fair value column of this table. Amounts also include notional amounts
related to interest rate swaps hedging fixed rate debt.
6 Asset and liability amounts include $6 million and $9 million of notional amounts from purchased and written credit risk participation agreements, respectively, whose notional
is calculated as the notional of the derivative participated adjusted by the relevant RWA conversion factor.
7 Includes $49 million notional amount that is based on the number of Visa Class B shares, 3.2 million, the conversion ratio from Class B shares to Class A shares, and the
Class A share price at the derivative inception date of May 28, 2009. This derivative was established upon the sale of Class B shares in the second quarter of 2009. See Note
16, “Guarantees” for additional information.