SunTrust 2015 Annual Report Download - page 121
Download and view the complete annual report
Please find page 121 of the 2015 SunTrust annual report below. You can navigate through the pages in the report by either clicking on the pages listed below, or by using the keyword search tool below to find specific information within the annual report.-
 1
1 -
2
-
3
-
4
-
5
-
6
-
7
-
8
-
9
-
10
-
11
-
12
-
13
-
14
-
15
-
16
-
17
-
18
-
19
-
20
-
21
-
22
-
23
-
24
-
25
-
26
-
27
-
28
-
29
-
30
-
31
-
32
-
33
-
34
-
35
-
36
-
37
-
38
-
39
-
40
-
41
-
42
-
43
-
44
-
45
-
46
-
47
-
48
-
49
-
50
-
51
-
52
-
53
-
54
-
55
-
56
-
57
-
58
-
59
-
60
-
61
-
62
-
63
-
64
-
65
-
66
-
67
-
68
-
69
-
70
-
71
-
72
-
73
-
74
-
75
-
76
-
77
-
78
-
79
-
80
-
81
-
82
-
83
-
84
-
85
-
86
-
87
-
88
-
89
-
90
-
91
-
92
-
93
-
94
-
95
-
96
-
97
-
98
-
99
-
100
-
101
-
102
-
103
-
104
-
105
-
106
-
107
-
108
-
109
-
110
-
 111
111 -
 112
112 -
 113
113 -
 114
114 -
 115
115 -
 116
116 -
 117
117 -
 118
118 -
 119
119 -
 120
120 -
 121
121 -
 122
122 -
 123
123 -
 124
124 -
 125
125 -
 126
126 -
 127
127 -
 128
128 -
 129
129 -
 130
130 -
 131
131 -
132
-
133
-
134
-
135
-
136
-
137
-
138
-
139
-
140
-
141
-
142
-
143
-
144
-
145
-
146
-
147
-
148
-
149
-
150
-
151
-
152
-
153
-
154
-
155
-
156
-
157
-
158
-
159
-
160
-
161
-
162
-
163
-
164
-
165
-
166
-
167
-
168
-
169
-
170
-
171
-
172
-
173
-
174
-
175
-
176
-
177
-
178
-
179
-
180
-
181
-
182
-
183
-
184
-
185
-
186
-
187
-
188
-
189
-
190
-
191
-
192
-
193
-
194
-
195
-
196
 |
 |

Notes to Consolidated Financial Statements, continued
93
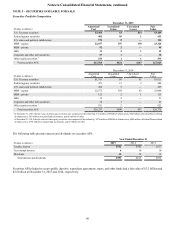
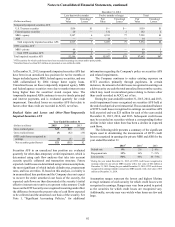
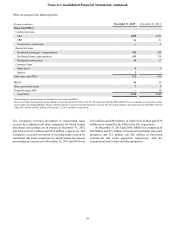
NOTE 6 - LOANS
Composition of Loan Portfolio
(Dollars in millions)
December 31,
2015
December 31,
2014
Commercial loans:
C&I $67,062 $65,440
CRE 6,236 6,741
Commercial construction 1,954 1,211
Total commercial loans 75,252 73,392
Residential loans:
Residential mortgages -
guaranteed 629 632
Residential mortgages -
nonguaranteed 124,744 23,443
Residential home equity
products 13,171 14,264
Residential construction 384 436
Total residential loans 38,928 38,775
Consumer loans:
Guaranteed student 4,922 4,827
Other direct 6,127 4,573
Indirect 10,127 10,644
Credit cards 1,086 901
Total consumer loans 22,262 20,945
LHFI $136,442 $133,112
LHFS 2$1,838 $3,232
1 Includes $257 million and $272 million of LHFI measured at fair value at
December 31, 2015 and 2014, respectively.
2 Includes $1.5 billion and $1.9 billion of LHFS measured at fair value at
December 31, 2015 and 2014, respectively.
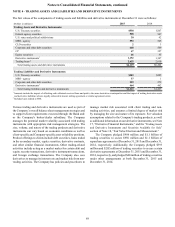
During the years ended December 31, 2015 and 2014, the
Company transferred $1.8 billion and $3.3 billion in LHFI to
LHFS, and $741 million and $44 million in LHFS to LHFI,
respectively. In addition to sales of mortgage LHFS in the normal
course of business, the Company sold $2.1 billion and $4.0
billion in loans and leases for gains of $22 million and $83
million, during the years ended December 31, 2015 and 2014,
respectively.
At December 31, 2015 and 2014, the Company had $23.6
billion and $26.5 billion of net eligible loan collateral pledged
to the Federal Reserve discount window to support $17.2 billion
and $18.4 billion of available, unused borrowing capacity,
respectively.
At December 31, 2015 and 2014, the Company had $33.7
billion and $31.2 billion of net eligible loan collateral pledged
to the FHLB of Atlanta to support $28.5 billion and $24.3 billion
of available borrowing capacity, respectively. The available
FHLB borrowing capacity at December 31, 2015 was used to
support $408 million of long-term debt and $6.7 billion of letters
of credit issued on the Company's behalf. At December 31, 2014,
the available FHLB borrowing capacity was used to support $4.0
billion of long-term debt, $4.0 billion of short-term debt, and
$7.9 billion of letters of credit issued on the Company's behalf.
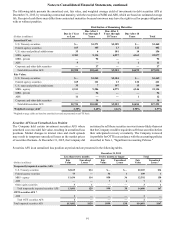
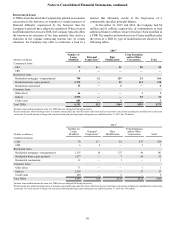
Credit Quality Evaluation
The Company evaluates the credit quality of its loan portfolio
by employing a dual internal risk rating system, which assigns
both PD and LGD ratings to derive expected losses. Assignment
of PD and LGD ratings are predicated upon numerous factors,
including consumer credit risk scores, rating agency
information, borrower/guarantor financial capacity, LTV ratios,
collateral type, debt service coverage ratios, collection
experience, other internal metrics/analyses, and/or qualitative
assessments.
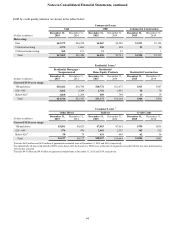
For the commercial portfolio, the Company believes that
the most appropriate credit quality indicator is an individual
loan’s risk assessment expressed according to the broad
regulatory agency classifications of Pass or Criticized. The
Company conforms to the following regulatory classifications
for Criticized assets: Other Assets Especially Mentioned (or
Special Mention), Adversely Classified, Doubtful, and Loss.
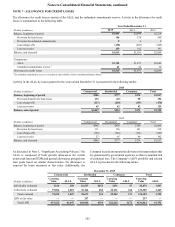
However, for the purposes of disclosure, management believes
the most meaningful distinction within the Criticized categories
is between Accruing Criticized (which includes Special Mention
and a portion of Adversely Classified) and Nonaccruing
Criticized (which includes a portion of Adversely Classified and
Doubtful and Loss). This distinction identifies those relatively
higher risk loans for which there is a basis to believe that the
Company will not collect all amounts due under those loan
agreements. The Company's risk rating system is granular, with
multiple risk ratings in both the Pass and Criticized categories.
Pass ratings reflect relatively low PDs, whereas, Criticized assets
have higher PDs. The granularity in Pass ratings assists in the
establishment of pricing, loan structures, approval requirements,
reserves, and ongoing credit management requirements.
Commercial risk ratings are refreshed at least annually, or more
frequently as appropriate, based upon considerations such as
market conditions, borrower characteristics, and portfolio
trends. Additionally, management routinely reviews portfolio
risk ratings, trends, and concentrations to support risk
identification and mitigation activities. The increase in criticized
accruing and nonaccruing C&I loans at December 31, 2015
compared to December 31, 2014, as presented in the following
risk rating table, was primarily driven by downgrades of loans
in the energy industry vertical.
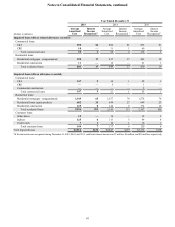
For consumer and residential loans, the Company monitors
credit risk based on indicators such as delinquencies and FICO
scores. The Company believes that consumer credit risk, as
assessed by the industry-wide FICO scoring method, is a relevant
credit quality indicator. Borrower-specific FICO scores are
obtained at origination as part of the Company’s formal
underwriting process, and refreshed FICO scores are obtained
by the Company at least quarterly.
For government-guaranteed loans, the Company monitors
the credit quality based primarily on delinquency status, as it is
a more relevant indicator of credit quality due to the government
guarantee. At December 31, 2015 and 2014, 31% and 28%,
respectively, of the guaranteed residential loan portfolio was
current with respect to payments. At December 31, 2015 and
2014, 78% and 79%, respectively, of the guaranteed student loan
portfolio was current with respect to payments. The Company's
loss exposure on guaranteed residential and student loans is
mitigated by the government guarantee.