SunTrust 2015 Annual Report Download - page 80
Download and view the complete annual report
Please find page 80 of the 2015 SunTrust annual report below. You can navigate through the pages in the report by either clicking on the pages listed below, or by using the keyword search tool below to find specific information within the annual report.-
 1
1 -
2
-
3
-
4
-
5
-
6
-
7
-
8
-
9
-
10
-
11
-
12
-
13
-
14
-
15
-
16
-
17
-
18
-
19
-
20
-
21
-
22
-
23
-
24
-
25
-
26
-
27
-
28
-
29
-
30
-
31
-
32
-
33
-
34
-
35
-
36
-
37
-
38
-
39
-
40
-
41
-
42
-
43
-
44
-
45
-
46
-
47
-
48
-
49
-
50
-
51
-
52
-
53
-
54
-
55
-
56
-
57
-
58
-
59
-
60
-
61
-
62
-
63
-
64
-
65
-
66
-
67
-
68
-
69
-
 70
70 -
 71
71 -
 72
72 -
 73
73 -
 74
74 -
 75
75 -
 76
76 -
 77
77 -
 78
78 -
 79
79 -
 80
80 -
 81
81 -
 82
82 -
 83
83 -
 84
84 -
 85
85 -
 86
86 -
 87
87 -
 88
88 -
 89
89 -
 90
90 -
91
-
92
-
93
-
94
-
95
-
96
-
97
-
98
-
99
-
100
-
101
-
102
-
103
-
104
-
105
-
106
-
107
-
108
-
109
-
110
-
111
-
112
-
113
-
114
-
115
-
116
-
117
-
118
-
119
-
120
-
121
-
122
-
123
-
124
-
125
-
126
-
127
-
128
-
129
-
130
-
131
-
132
-
133
-
134
-
135
-
136
-
137
-
138
-
139
-
140
-
141
-
142
-
143
-
144
-
145
-
146
-
147
-
148
-
149
-
150
-
151
-
152
-
153
-
154
-
155
-
156
-
157
-
158
-
159
-
160
-
161
-
162
-
163
-
164
-
165
-
166
-
167
-
168
-
169
-
170
-
171
-
172
-
173
-
174
-
175
-
176
-
177
-
178
-
179
-
180
-
181
-
182
-
183
-
184
-
185
-
186
-
187
-
188
-
189
-
190
-
191
-
192
-
193
-
194
-
195
-
196
 |
 |
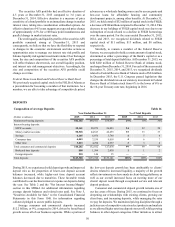
52
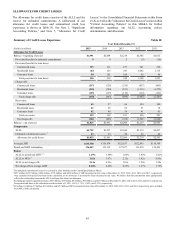
For the year ended December 31, 2015, our total daily
average short-term borrowings decreased $4.5 billion, or 48%,
compared to the year ended December 31, 2014. The decrease
was driven primarily by a $4.0 billion decrease in other short-
term borrowings and a $381 million decrease in securities sold
under agreements to repurchase. The decrease in other short-
term borrowings was due to reductions in FHLB advances and
master notes of $3.1 billion and $1.0 billion, respectively,
partially offset by a $173 million increase in dealer collateral
held. These reductions in wholesale funding were enabled by
strong growth in client deposits.
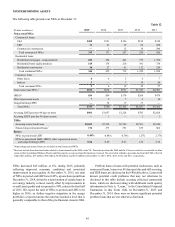
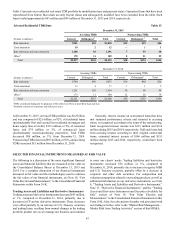
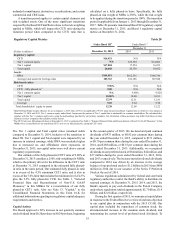
Long-Term Debt
Long-term debt at December 31 consisted of the following:
Table 19
(Dollars in millions) 2015 2014
Parent Company Only:
Senior, fixed rate $3,614 $3,630
Senior, variable rate 331 358
Subordinated, fixed rate 200 200
Junior subordinated, variable rate 627 627
Total Parent Company debt 4,772 4,815
Subsidiaries:
Senior, fixed rate 1,620 5,682
Senior, variable rate 1,097 742
Subordinated, fixed rate 1973 1,283
Subordinated, variable rate —500
Total subsidiaries debt 3,690 8,207
Total long-term debt $8,462 $13,022
1 Debt recorded at fair value.
During the year ended December 31, 2015, our long-term debt
decreased by $4.6 billion, or 35%, driven primarily by the early
terminations of $3.8 billion in FHLB advances and maturities of
$769 million in subordinated debt. These terminations were
related to a repositioning of the balance sheet and resulted in the
recognition of $24 million in debt extinguishment costs, net of
related hedges, in 2015.
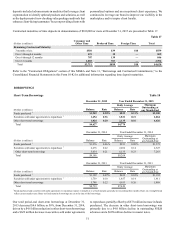
Average long-term debt for 2015 decreased $1.5 billion, or
12%, compared to 2014, driven primarily by a $1.2 billion
decrease in average long-term FHLB advances. See Note 11,
“Borrowings and Contractual Commitments,” to the
Consolidated Financial Statements in this Form 10-K for
additional information.
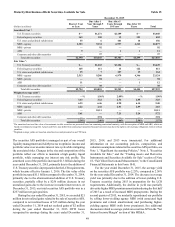
CAPITAL RESOURCES
Regulatory Capital
Our primary federal regulator, the Federal Reserve, measures
capital adequacy within a framework that sets capital
requirements relative to the risk profiles of individual banks. The
framework assigns risk weights to assets and off-balance sheet
risk exposures according to predefined classifications, creating
a base from which to compare capital levels. Effective January
1, 2015, we measure capital adequacy using the standardized
approach to the Federal Reserve's Basel III Final Rule. Basel III
retained the general framework from the prior capital adequacy
calculations under Basel I, but certain predefined classifications
have changed and risk weightings have been revised.
Additionally, Basel III introduced a new capital measure, CET1,
and revised what comprises Tier 1 and Total capital. Further,
Basel III revised the requirements related to minimum capital
adequacy levels.
CET1 is limited to common equity and related surplus (net
of treasury stock), retained earnings, AOCI, and common equity
minority interest, subject to limitations. Certain regulatory
adjustments and exclusions are made to CET1, including
removal of goodwill, other intangible assets, certain DTAs, the
impact on capital arising from mark-to-market adjustments
related to our credit spreads, and certain defined benefit pension
fund net assets. Further, banks employing the standardized
approach to Basel III were granted a one-time permanent election
to exclude AOCI from the calculation of regulatory capital. We
elected to exclude AOCI from the calculation of our CET1.
Tier 1 capital includes CET1, qualified preferred equity
instruments, qualifying minority interest not included in CET1,
subject to limitations, and certain other regulatory deductions.
Tier 1 capital included a portion of trust preferred securities in
2015, but those instruments will be completely phased-out of
Tier 1 capital effective January 1, 2016 and will be reclassified
as Tier 2 capital. As a result, the $627 million in principal amount
of Parent Company trust preferred securities outstanding that
received partial Tier 1 capital treatment in 2015 will be treated
as Tier 2 capital beginning on January 1, 2016, using the
methodology specified in Basel III.
Total capital consists of Tier 1 capital and Tier 2 capital,
which includes qualifying portions of subordinated debt, trust
preferred securities and minority interest not included in Tier 1
capital, ALLL up to a maximum of 1.25% of RWA, and a limited
percentage of unrealized gains on equity securities.
To be considered "adequately capitalized," we are subject
to minimum CET1, Tier 1 capital, and Total capital ratios of
4.5%, 6%, and 8%, respectively. To be considered “well-
capitalized,” Tier 1 and Total capital ratios of 6% and 10%,
respectively, are required. Additionally, beginning in 2016, a
CCB amount of 0.625% is required to be maintained above the
minimum capital ratios. The CCB will continue to increase each
year through January 1, 2019 when the CCB amount will be fully
phased-in at 2.5% above the minimum capital ratios. The CCB
places restrictions on the amount of retained earnings that may
be used for capital distributions or discretionary bonus payments
as risk-based capital ratios approach their respective “adequately
capitalized” minimum capital ratios plus the CCB.
We are also subject to a Tier 1 leverage ratio requirement,
which measures Tier 1 capital against average total assets less
certain deductions, as calculated in accordance with regulatory
guidelines. The minimum leverage ratio threshold is 4% and is
not subject to the CCB.
Risk weighting under Basel III was modified primarily to
enhance risk sensitivity of RWA. Additional risk weight
categories were added and certain calculation methodologies
were introduced to more precisely calculate exposure risk.
Exposures that received a significant risk weight and/or
calculation methodology change compared to Basel I included
certain nonperforming and past-due loans, MSRs, certain