SunTrust 2015 Annual Report Download - page 98
Download and view the complete annual report
Please find page 98 of the 2015 SunTrust annual report below. You can navigate through the pages in the report by either clicking on the pages listed below, or by using the keyword search tool below to find specific information within the annual report.70
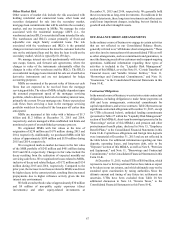
Total noninterest income was $460 million, a decrease of
$13 million, or 3%, compared to 2014. The decrease was
primarily driven by gains on the sale of government-guaranteed
residential loans in the second and third quarters of 2014 and a
decline in mortgage servicing income, partially offset by higher
mortgage production income. Mortgage servicing income was
$169 million, a decrease of $27 million, or 14%, driven by higher
prepayments, partially offset by higher servicing fees. Total loans
serviced for others were $121.0 billion at December 31, 2015,
compared to $115.5 billion at December 31, 2014. The 5%
increase was largely attributable to the purchase of MSRs in
2015. Mortgage production related income increased $69
million, compared to 2014, due to higher gain on sale revenue,
a decline in the repurchase provision, and higher production
related fee income. Loan originations were $22.7 billion for the
year ended December 31, 2015, compared to $16.4 billion for
2014, an increase of $6.3 billion, or 38%. Other income
decreased $54 million, predominantly driven by the
aforementioned gains on the sale of government-guaranteed
residential loans in 2014, partially offset by gains on loan sales
in 2015.
Total noninterest expense was $682 million, a decline of
$367 million, or 35%, compared to 2014. The decrease was
primarily attributable to a $387 million decline in operating
losses driven by mortgage-related legal matters recognized in
2014. In 2015, higher mortgage production volumes resulted in
increases in staff expenses and outside processing costs and
credit services, compared to 2014.
Corporate Other
Corporate Other net income for the year ended December 31,
2015 was $159 million, a decrease of $275 million, or 63%,
compared to 2014. The decrease in net income was primarily
due to the $105 million gain on sale of RidgeWorth in 2014 and
a decline in net interest income, partially offset by lower
noninterest expenses.
Net interest income for the year ended December 31, 2015
was $150 million, a decrease of $129 million, or 46%, compared
to 2014. The decrease was primarily due to a $125 million decline
in commercial loan related swap income. Additionally, growth
in client deposits during 2015 enabled reductions of $3.7 billion,
or 66%, and $1.4 billion, or 12%, in average short-term
borrowings and average long-term debt, respectively.
Total noninterest income was $99 million, a decrease of
$139 million, or 58%, compared to 2014. The decrease was
primarily due to the gain on the sale of RidgeWorth in 2014,
foregone trust and investment management income as a result
of the sale of RidgeWorth, partially offset by higher 2015 mark-
to-market valuation gains on public debt measured at fair value
and net gains on the sale of securities AFS of $21 million in 2015,
compared to losses of $15 million on the sale of securities AFS
in 2014.
Total noninterest expense was $15 million, a decline of $77
million compared to 2014. The decline was primarily due to
expense reductions resulting from the sale of RidgeWorth, and
a decline in severance costs, compared to 2014. These declines
were partially offset by the $24 million of debt extinguishment
costs, net of related hedges, associated with balance sheet
repositioning during 2015.
Year Ended December 31, 2014 vs. 2013
Consumer Banking and Private Wealth Management
Consumer Banking and Private Wealth Management reported
net income of $695 million for the year ended December 31,
2014, an increase of $42 million, or 6%, compared to 2013. The
increase in net income was primarily driven by increased total
revenue and continued improvement in credit quality resulting
in lower provision for credit losses, which in aggregate more
than offset a 3% increase in expenses.
Net interest income was $2.6 billion, an increase of $34
million, or 1%, compared to 2013, driven by increased average
deposit and loan balances, partially offset by lower rate spreads.
Net interest income related to deposits increased $14 million, or
1%, driven by a $1.8 billion, or 2%, increase in average deposit
balances, partially offset by a three basis point decrease in deposit
spreads. Favorable deposit mix trends continued as average
deposit balances increased in all lower cost account categories,
offsetting a $2.0 billion, or 15%, decline in average time deposits.
Net interest income related to loans increased $3 million, driven
by a $1.2 billion increase in average loan balances, partially
offset by a six basis point decrease in loan spreads. The increase
in average loans was primarily driven by growth in consumer
loans, which more than offset home equity line paydowns and a
decline in nonaccrual loans. Other funding costs related to other
assets improved by $19 million, driven primarily by a decline in
funding rates.
Provision for credit losses was $191 million, a decrease of
$70 million, or 27%, compared to 2013. The decrease was
primarily driven by declines in home equity line and commercial
loan net charge-offs, partially offset by an increase in
nonguaranteed student loan net charge-offs.
Total noninterest income was $1.5 billion, an increase of
$45 million, or 3%, compared to 2013, driven by an increase in
retail investment income, trust and investment management,
card fees and insurance income, partially offset by a decrease in
service charges on deposits.
Total noninterest expense was $2.9 billion, an increase of
$83 million, or 3%, compared to 2013. The increase was driven
by higher staff expenses related to investment in revenue
generating positions, primarily in wealth management-related
businesses to help fulfill more of our clients’ wealth and
investment management needs. Additionally, higher operating
losses were partially offset by a decrease in other operating
expenses.
Wholesale Banking
Wholesale Banking reported net income of $875 million for the
year ended December 31, 2014, an increase of $68 million, or
8%, compared to 2013. The increase in net income was
attributable to an increase in net interest income and a decrease
in provision for credit losses, partially offset by an increase in
noninterest expense.
Net interest income was $1.8 billion, a $127 million, or 8%,
increase compared to 2013, driven by increases in average loan
and deposit balances, partially offset by lower rate spreads. Net
interest income related to loans increased, as average loan
balances grew $8.5 billion, or 16%, led by C&I, CRE, and tax-
exempt loans. Net interest income related to client deposits
increased as average deposit balances grew $4.0 billion, or 10%,


