SunTrust 2015 Annual Report Download - page 106
Download and view the complete annual report
Please find page 106 of the 2015 SunTrust annual report below. You can navigate through the pages in the report by either clicking on the pages listed below, or by using the keyword search tool below to find specific information within the annual report.-
 1
1 -
2
-
3
-
4
-
5
-
6
-
7
-
8
-
9
-
10
-
11
-
12
-
13
-
14
-
15
-
16
-
17
-
18
-
19
-
20
-
21
-
22
-
23
-
24
-
25
-
26
-
27
-
28
-
29
-
30
-
31
-
32
-
33
-
34
-
35
-
36
-
37
-
38
-
39
-
40
-
41
-
42
-
43
-
44
-
45
-
46
-
47
-
48
-
49
-
50
-
51
-
52
-
53
-
54
-
55
-
56
-
57
-
58
-
59
-
60
-
61
-
62
-
63
-
64
-
65
-
66
-
67
-
68
-
69
-
70
-
71
-
72
-
73
-
74
-
75
-
76
-
77
-
78
-
79
-
80
-
81
-
82
-
83
-
84
-
85
-
86
-
87
-
88
-
89
-
90
-
91
-
92
-
93
-
94
-
95
-
 96
96 -
 97
97 -
 98
98 -
 99
99 -
 100
100 -
 101
101 -
 102
102 -
 103
103 -
 104
104 -
 105
105 -
 106
106 -
 107
107 -
 108
108 -
 109
109 -
 110
110 -
 111
111 -
 112
112 -
 113
113 -
 114
114 -
 115
115 -
 116
116 -
117
-
118
-
119
-
120
-
121
-
122
-
123
-
124
-
125
-
126
-
127
-
128
-
129
-
130
-
131
-
132
-
133
-
134
-
135
-
136
-
137
-
138
-
139
-
140
-
141
-
142
-
143
-
144
-
145
-
146
-
147
-
148
-
149
-
150
-
151
-
152
-
153
-
154
-
155
-
156
-
157
-
158
-
159
-
160
-
161
-
162
-
163
-
164
-
165
-
166
-
167
-
168
-
169
-
170
-
171
-
172
-
173
-
174
-
175
-
176
-
177
-
178
-
179
-
180
-
181
-
182
-
183
-
184
-
185
-
186
-
187
-
188
-
189
-
190
-
191
-
192
-
193
-
194
-
195
-
196
 |
 |
78
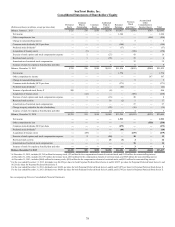
SunTrust Banks, Inc.
Consolidated Statements of Shareholders’ Equity
(Dollars and shares in millions, except per share data)
Preferred
Stock
Common
Shares
Outstanding
Common
Stock
Additional
Paid-in
Capital
Retained
Earnings
Treasury
Stock
and Other 1
Accumulated
Other
Comprehensive
Income/(Loss) Total
Balance, January 1, 2013 $725 539 $550 $9,174 $10,817 ($590) $309 $20,985
Net income — — — — 1,344 — — 1,344
Other comprehensive loss — — — — — — (598) (598)
Change in noncontrolling interest — — — — — 5 — 5
Common stock dividends, $0.35 per share — — — — (188) — — (188)
Preferred stock dividends 2— — — — (37) — — (37)
Acquisition of treasury stock — (5) — — — (150) — (150)
Exercise of stock options and stock compensation expense — 1 — (27) — 43 — 16
Restricted stock activity — 1 — (35) — 39 — 4
Amortization of restricted stock compensation — — — — — 32 — 32
Issuance of stock for employee benefit plans and other — — — 3 — 6 — 9
Balance, December 31, 2013 $725 536 $550 $9,115 $11,936 ($615) ($289) $21,422
Net income — — — — 1,774 — — 1,774
Other comprehensive income — — — — — — 167 167
Change in noncontrolling interest — — — — — 5 — 5
Common stock dividends, $0.70 per share — — — — (371) — — (371)
Preferred stock dividends 2— — — — (42) — — (42)
Issuance of preferred stock, Series F 500 — — (4) — — — 496
Acquisition of treasury stock — (12) — — — (458) — (458)
Exercise of stock options and stock compensation expense — 1 — (16) — 20 — 4
Restricted stock activity — — — 18 (2) 1 — 17
Amortization of restricted stock compensation — — — — — 27 — 27
Change in equity related to the sale of subsidiary — — — (23) — (16) — (39)
Issuance of stock for employee benefit plans and other — — — (1) — 4 — 3
Balance, December 31, 2014 $1,225 525 $550 $9,089 $13,295 ($1,032) ($122) $23,005
Net income — — — — 1,933 — — 1,933
Other comprehensive loss — — — — — — (338) (338)
Common stock dividends, $0.92 per share — — — — (475) — — (475)
Preferred stock dividends 2— — — — (64) — — (64)
Acquisition of treasury stock — (17) — — — (679) — (679)
Exercise of stock options and stock compensation expense — 1 — (18) — 30 — 12
Restricted stock activity — — — 23 (3) 4 — 24
Amortization of restricted stock compensation — — — — — 16 — 16
Issuance of stock for employee benefit plans and other — — — — — 3 — 3
Balance, December 31, 2015 $1,225 509 $550 $9,094 $14,686 ($1,658) ($460) $23,437
1 At December 31, 2015, includes ($1,764) million for treasury stock, ($2) million for the compensation element of restricted stock, and $108 million for noncontrolling interest.
At December 31, 2014, includes ($1,119) million for treasury stock, ($21) million for the compensation element of restricted stock, and $108 million for noncontrolling interest.
At December 31, 2013, includes ($684) million for treasury stock, ($50) million for the compensation element of restricted stock, and $119 million for noncontrolling interest.
2 For the year ended December 31, 2015, dividends were $4,056 per share for both Perpetual Preferred Stock Series A and B, $5,875 per share for Perpetual Preferred Stock Series E, and
$6,219 per share for Perpetual Preferred Stock Series F.
For the year ended December 31, 2014, dividends were $4,056 per share for both Perpetual Preferred Stock Series A and B, and $5,875 per share for Perpetual Preferred Stock Series E.
For the year ended December 31, 2013, dividends were $4,056 per share for both Perpetual Preferred Stock Series A and B, and $5,793 per share for Perpetual Preferred Stock Series E.
See accompanying Notes to Consolidated Financial Statements.