SunTrust 2015 Annual Report Download - page 182
Download and view the complete annual report
Please find page 182 of the 2015 SunTrust annual report below. You can navigate through the pages in the report by either clicking on the pages listed below, or by using the keyword search tool below to find specific information within the annual report.-
 1
1 -
2
-
3
-
4
-
5
-
6
-
7
-
8
-
9
-
10
-
11
-
12
-
13
-
14
-
15
-
16
-
17
-
18
-
19
-
20
-
21
-
22
-
23
-
24
-
25
-
26
-
27
-
28
-
29
-
30
-
31
-
32
-
33
-
34
-
35
-
36
-
37
-
38
-
39
-
40
-
41
-
42
-
43
-
44
-
45
-
46
-
47
-
48
-
49
-
50
-
51
-
52
-
53
-
54
-
55
-
56
-
57
-
58
-
59
-
60
-
61
-
62
-
63
-
64
-
65
-
66
-
67
-
68
-
69
-
70
-
71
-
72
-
73
-
74
-
75
-
76
-
77
-
78
-
79
-
80
-
81
-
82
-
83
-
84
-
85
-
86
-
87
-
88
-
89
-
90
-
91
-
92
-
93
-
94
-
95
-
96
-
97
-
98
-
99
-
100
-
101
-
102
-
103
-
104
-
105
-
106
-
107
-
108
-
109
-
110
-
111
-
112
-
113
-
114
-
115
-
116
-
117
-
118
-
119
-
120
-
121
-
122
-
123
-
124
-
125
-
126
-
127
-
128
-
129
-
130
-
131
-
132
-
133
-
134
-
135
-
136
-
137
-
138
-
139
-
140
-
141
-
142
-
143
-
144
-
145
-
146
-
147
-
148
-
149
-
150
-
151
-
152
-
153
-
154
-
155
-
156
-
157
-
158
-
159
-
160
-
161
-
162
-
163
-
164
-
165
-
166
-
167
-
168
-
169
-
170
-
171
-
 172
172 -
 173
173 -
 174
174 -
 175
175 -
 176
176 -
 177
177 -
 178
178 -
 179
179 -
 180
180 -
 181
181 -
 182
182 -
 183
183 -
 184
184 -
 185
185 -
 186
186 -
 187
187 -
 188
188 -
 189
189 -
 190
190 -
 191
191 -
 192
192 -
193
-
194
-
195
-
196
 |
 |
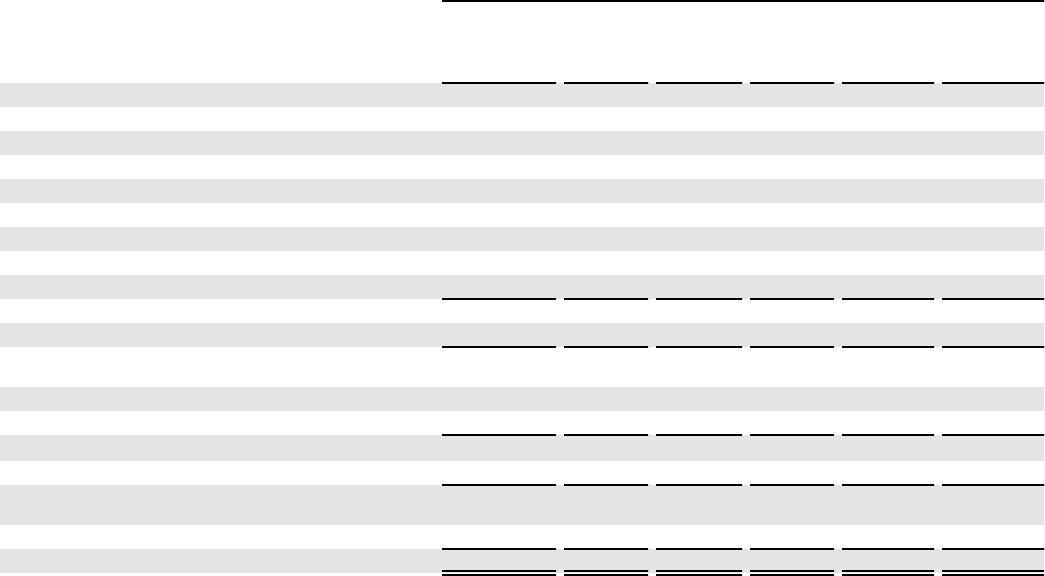
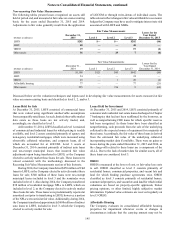
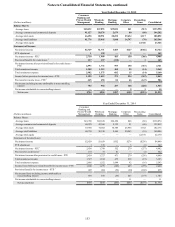
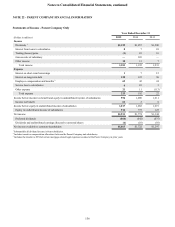
Notes to Consolidated Financial Statements, continued
154
Year Ended December 31, 2013
(Dollars in millions)
Consumer
Banking and
Private Wealth
Management
Wholesale
Banking
Mortgage
Banking
Corporate
Other
Reconciling
Items Consolidated
Balance Sheets:
Average loans $40,510 $54,142 $27,974 $50 ($19) $122,657
Average consumer and commercial deposits 84,289 39,572 3,206 98 (89) 127,076
Average total assets 45,538 66,095 32,708 26,505 1,651 172,497
Average total liabilities 85,167 46,693 3,845 15,720 (95) 151,330
Average total equity — — — — 21,167 21,167
Statements of Income/(Loss):
Net interest income $2,595 $1,547 $539 $316 ($144) $4,853
FTE adjustment 1 124 — 3 (1) 127
Net interest income - FTE 12,596 1,671 539 319 (145) 4,980
Provision/(benefit) for credit losses 2261 124 170 (1) (1) 553
Net interest income after provision/(benefit) for credit losses -
FTE 2,335 1,547 369 320 (144) 4,427
Total noninterest income 1,482 1,103 402 237 (10) 3,214
Total noninterest expense 2,783 1,455 1,503 100 (10) 5,831
Income/(loss) before provision/(benefit) for income taxes - FTE 1,034 1,195 (732) 457 (144) 1,810
Provision/(benefit) for income taxes - FTE 3381 388 (205) (68) (47) 449
Net income/(loss) including income attributable to
noncontrolling interest 653 807 (527) 525 (97) 1,361
Net income attributable to noncontrolling interest — — — 17 — 17
Net income/(loss) $653 $807 ($527) $508 ($97) $1,344
1 Presented on a matched maturity funds transfer price basis for the segments.
2 Provision/(benefit) for credit losses represents net charge-offs by segment combined with an allocation to the segments of the provision/(benefit) attributable to quarterly
changes in the ALLL and unfunded commitment reserve balances.
3 Includes regular income tax provision/(benefit) and taxable-equivalent income adjustment reversal.