SunTrust 2015 Annual Report Download - page 57
Download and view the complete annual report
Please find page 57 of the 2015 SunTrust annual report below. You can navigate through the pages in the report by either clicking on the pages listed below, or by using the keyword search tool below to find specific information within the annual report.-
 1
1 -
2
-
3
-
4
-
5
-
6
-
7
-
8
-
9
-
10
-
11
-
12
-
13
-
14
-
15
-
16
-
17
-
18
-
19
-
20
-
21
-
22
-
23
-
24
-
25
-
26
-
27
-
28
-
29
-
30
-
31
-
32
-
33
-
34
-
35
-
36
-
37
-
38
-
39
-
40
-
41
-
42
-
43
-
44
-
45
-
46
-
 47
47 -
 48
48 -
 49
49 -
 50
50 -
 51
51 -
 52
52 -
 53
53 -
 54
54 -
 55
55 -
 56
56 -
 57
57 -
 58
58 -
 59
59 -
 60
60 -
 61
61 -
 62
62 -
 63
63 -
 64
64 -
 65
65 -
 66
66 -
 67
67 -
68
-
69
-
70
-
71
-
72
-
73
-
74
-
75
-
76
-
77
-
78
-
79
-
80
-
81
-
82
-
83
-
84
-
85
-
86
-
87
-
88
-
89
-
90
-
91
-
92
-
93
-
94
-
95
-
96
-
97
-
98
-
99
-
100
-
101
-
102
-
103
-
104
-
105
-
106
-
107
-
108
-
109
-
110
-
111
-
112
-
113
-
114
-
115
-
116
-
117
-
118
-
119
-
120
-
121
-
122
-
123
-
124
-
125
-
126
-
127
-
128
-
129
-
130
-
131
-
132
-
133
-
134
-
135
-
136
-
137
-
138
-
139
-
140
-
141
-
142
-
143
-
144
-
145
-
146
-
147
-
148
-
149
-
150
-
151
-
152
-
153
-
154
-
155
-
156
-
157
-
158
-
159
-
160
-
161
-
162
-
163
-
164
-
165
-
166
-
167
-
168
-
169
-
170
-
171
-
172
-
173
-
174
-
175
-
176
-
177
-
178
-
179
-
180
-
181
-
182
-
183
-
184
-
185
-
186
-
187
-
188
-
189
-
190
-
191
-
192
-
193
-
194
-
195
-
196
 |
 |

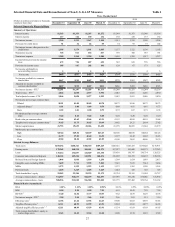
29
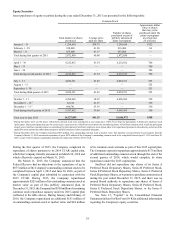
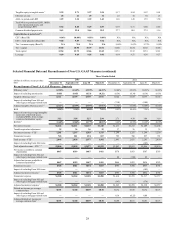
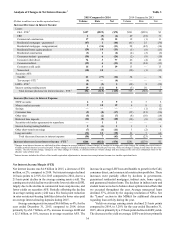
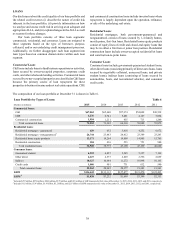
Selected Financial Data and Reconcilement of Non-U.S. GAAP Measures (continued)
Reconcilement of Non-U.S. GAAP Measures - Quarterly (continued)
(Dollars in millions, except per share
data)
December 31,
2015
September 30,
2015
June 30,
2015
March 31,
2015
December 31,
2014
September 30,
2014
June 30,
2014
March 31,
2014
Total shareholders’ equity $23,437 $23,664 $23,223 $23,260 $23,005 $22,269 $22,131 $21,817
Goodwill, net of deferred taxes 9(6,097) (6,100) (6,103) (6,106) (6,123) (6,127) (6,131) (6,184)
Other intangible assets, net
of deferred taxes, and MSRs 10 (1,322) (1,279) (1,412) (1,193) (1,219) (1,320) (1,276) (1,281)
MSRs 1,307 1,262 1,393 1,181 1,206 1,305 1,259 1,251
Tangible equity 17,325 17,547 17,101 17,142 16,869 16,127 15,983 15,603
Preferred stock (1,225) (1,225) (1,225) (1,225) (1,225) (725) (725) (725)
Tangible common equity $16,100 $16,322 $15,876 $15,917 $15,644 $15,402 $15,258 $14,878
Total assets $190,817 $187,036 $188,858 $189,881 $190,328 $186,818 $182,559 $179,542
Goodwill (6,337) (6,337) (6,337) (6,337) (6,337) (6,337) (6,337) (6,337)
Other intangible assets including
MSRs (1,325) (1,282) (1,416) (1,193) (1,219) (1,320) (1,277) (1,282)
MSRs 1,307 1,262 1,393 1,181 1,206 1,305 1,259 1,251
Tangible assets $184,462 $180,679 $182,498 $183,532 $183,978 $180,466 $176,204 $173,174
Tangible equity to tangible assets 79.39% 9.71% 9.37% 9.34% 9.17% 8.94% 9.07% 9.01%
Tangible book value per common
share3$31.65 $31.75 $30.65 $30.49 $29.82 $29.21 $28.64 $27.82
Period-end LHFI $136,442 $133,560 $132,538 $132,380 $133,112 $132,151 $129,744 $129,196
Government-guaranteed LHFI (5,551) (5,215) (5,026) (4,992) (5,459) (5,965) (6,081) (8,828)
LHFI at fair value (257) (262) (263) (268) (272) (284) (292) (299)
Period-end LHFI, excluding
government-guaranteed and fair
value loans $130,634 $128,083 $127,249 $127,120 $127,381 $125,902 $123,371 $120,069
ALLL to period-end LHFI,
excluding government-
guaranteed and fair value loans 11 1.34% 1.39% 1.44% 1.49% 1.52% 1.56% 1.62% 1.70%