SunTrust 2015 Annual Report Download - page 56
Download and view the complete annual report
Please find page 56 of the 2015 SunTrust annual report below. You can navigate through the pages in the report by either clicking on the pages listed below, or by using the keyword search tool below to find specific information within the annual report.-
 1
1 -
2
-
3
-
4
-
5
-
6
-
7
-
8
-
9
-
10
-
11
-
12
-
13
-
14
-
15
-
16
-
17
-
18
-
19
-
20
-
21
-
22
-
23
-
24
-
25
-
26
-
27
-
28
-
29
-
30
-
31
-
32
-
33
-
34
-
35
-
36
-
37
-
38
-
39
-
40
-
41
-
42
-
43
-
44
-
45
-
 46
46 -
 47
47 -
 48
48 -
 49
49 -
 50
50 -
 51
51 -
 52
52 -
 53
53 -
 54
54 -
 55
55 -
 56
56 -
 57
57 -
 58
58 -
 59
59 -
 60
60 -
 61
61 -
 62
62 -
 63
63 -
 64
64 -
 65
65 -
 66
66 -
67
-
68
-
69
-
70
-
71
-
72
-
73
-
74
-
75
-
76
-
77
-
78
-
79
-
80
-
81
-
82
-
83
-
84
-
85
-
86
-
87
-
88
-
89
-
90
-
91
-
92
-
93
-
94
-
95
-
96
-
97
-
98
-
99
-
100
-
101
-
102
-
103
-
104
-
105
-
106
-
107
-
108
-
109
-
110
-
111
-
112
-
113
-
114
-
115
-
116
-
117
-
118
-
119
-
120
-
121
-
122
-
123
-
124
-
125
-
126
-
127
-
128
-
129
-
130
-
131
-
132
-
133
-
134
-
135
-
136
-
137
-
138
-
139
-
140
-
141
-
142
-
143
-
144
-
145
-
146
-
147
-
148
-
149
-
150
-
151
-
152
-
153
-
154
-
155
-
156
-
157
-
158
-
159
-
160
-
161
-
162
-
163
-
164
-
165
-
166
-
167
-
168
-
169
-
170
-
171
-
172
-
173
-
174
-
175
-
176
-
177
-
178
-
179
-
180
-
181
-
182
-
183
-
184
-
185
-
186
-
187
-
188
-
189
-
190
-
191
-
192
-
193
-
194
-
195
-
196
 |
 |
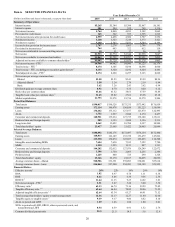
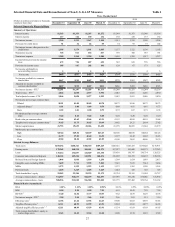
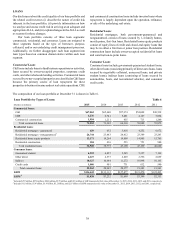
28
Tangible equity to tangible assets 79.39 9.71 9.37 9.34 9.17 8.94 9.07 9.01
Effective tax rate 28 26 29 31 25 10 30 23
ALLL to period-end LHFI 1.29 1.34 1.39 1.43 1.46 1.49 1.55 1.58
Total NPAs to period-end LHFI, OREO,
other repossessed assets, and
nonperforming LHFS 0.54 0.40 0.49 0.53 0.59 0.71 0.80 0.85
Common dividend payout ratio 26.2 23.8 26.6 25.5 27.7 18.8 27.5 13.6
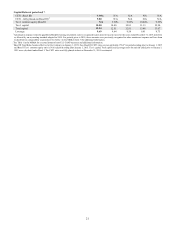
Capital Ratios at period end 8:
CET1 (Basel III) 9.96% 10.04% 9.93% 9.89% N/A N/A N/A N/A
CET1 - fully phased-in (Basel III) 9.80 9.89 9.76 9.74 N/A N/A N/A N/A
Tier 1 common equity (Basel I) N/A N/A N/A N/A 9.60% 9.63% 9.72% 9.90%
Tier 1 capital 10.80 10.90 10.79 10.76 10.80 10.54 10.66 10.88
Total capital 12.54 12.72 12.66 12.69 12.51 12.32 12.53 12.81
Leverage 9.69 9.68 9.56 9.41 9.64 9.51 9.56 9.57
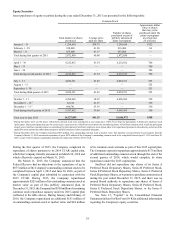
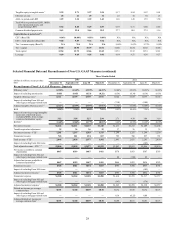
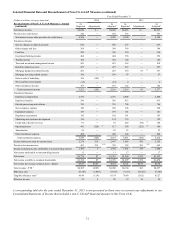
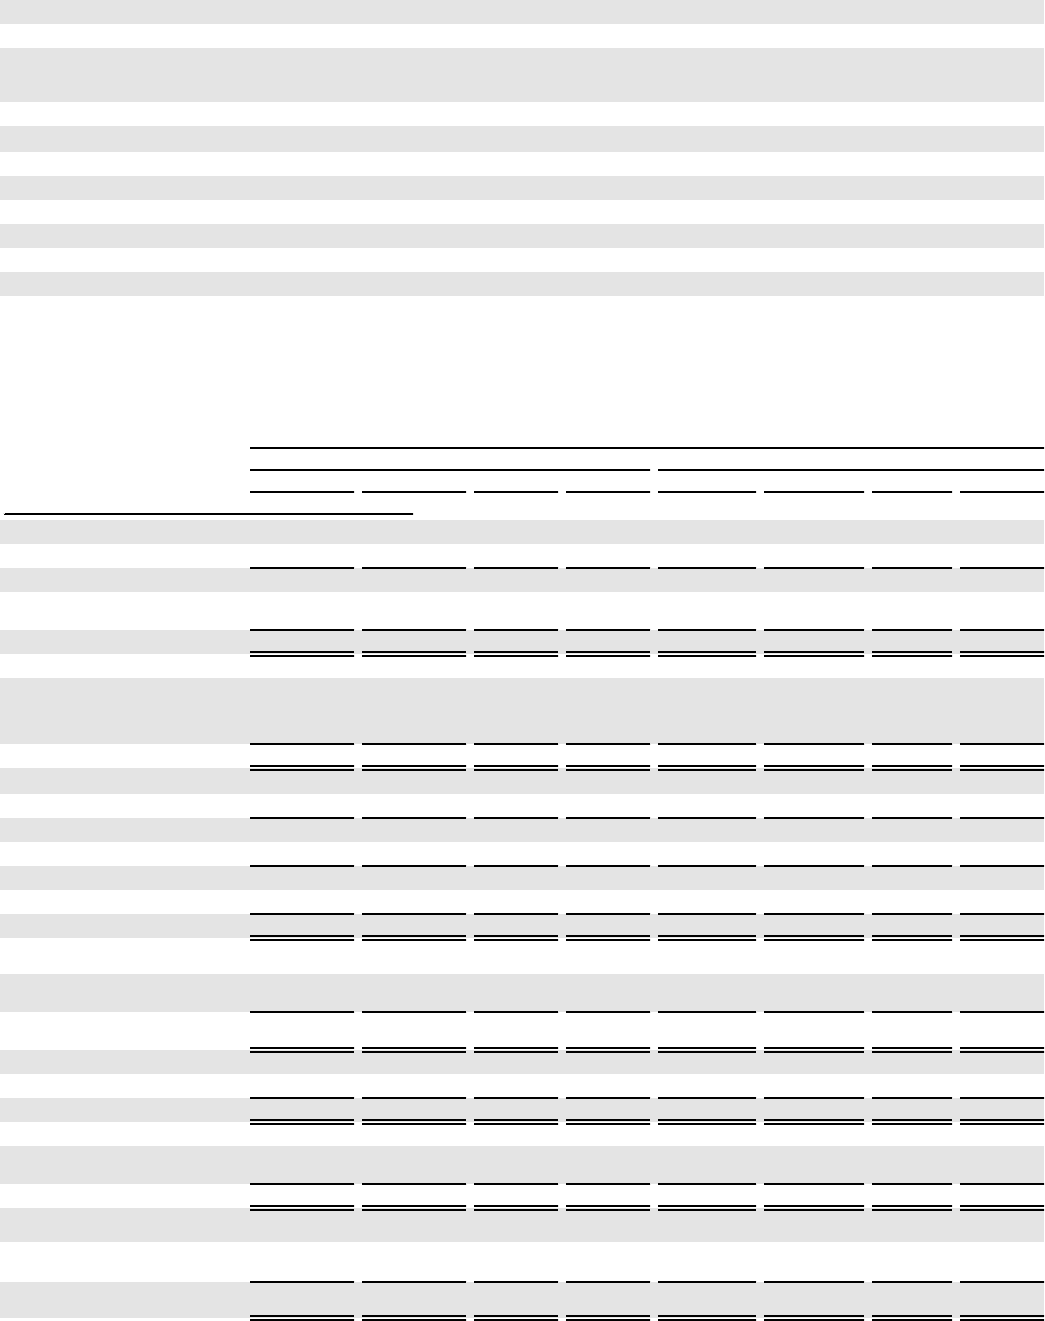
Selected Financial Data and Reconcilement of Non-U.S. GAAP Measures (continued)
Three Months Ended
(Dollars in millions, except per share
data)
2015 2014
December 31 September 30 June 30 March 31 December 31 September 30 June 30 March 31
Reconcilement of Non-U.S. GAAP Measures - Quarterly
Efficiency ratio 562.96% 61.44% 63.92% 64.23% 69.00% 62.03% 68.93% 66.83%
Impact of excluding amortization (0.85) (0.45) (0.33) (0.32) (0.56) (0.34) (0.16) (0.18)
Tangible efficiency ratio 662.11 60.99 63.59 63.91 68.44 61.69 68.77 66.65
Impact of excluding Form 8-K and
other legacy mortgage-related items — — — — (7.10) — (5.08) —
Adjusted tangible efficiency ratio1, 6 62.11% 60.99% 63.59% 63.91% 61.34% 61.69% 63.69% 66.65%
ROE 8.28% 9.30% 8.50% 7.59% 6.91% 10.41% 7.29% 7.59%
Impact of removing average intangible
assets (net of deferred taxes),
excluding MSRs, from average
common shareholders' equity 3.12 3.54 3.27 2.94 2.71 4.18 3.00 3.19
ROTCE 4 11.40% 12.84% 11.77% 10.53% 9.62% 14.59% 10.29% 10.78%
Net interest income $1,246 $1,211 $1,167 $1,140 $1,211 $1,215 $1,209 $1,204
Taxable-equivalent adjustment 35 36 36 35 37 36 35 35
Net interest income - FTE 2 1,281 1,247 1,203 1,175 1,248 1,251 1,244 1,239
Noninterest income 765 811 874 817 795 780 957 791
Total revenue - FTE 22,046 2,058 2,077 1,992 2,043 2,031 2,201 2,030
Impact of excluding Form 8-K items — — — — — — (105) —
Total adjusted revenue - FTE 1, 2 $2,046 $2,058 $2,077 $1,992 $2,043 $2,031 $2,096 $2,030
Net income available to common
shareholders $467 $519 $467 $411 $378 $563 $387 $393
Impact of excluding Form 8-K and
other legacy mortgage-related items — — — — 88 (130) 49 —
Adjusted net income available to
common shareholders 1 $467 $519 $467 $411 $466 $433 $436 $393
Noninterest income $765 $811 $874 $817 $795 $780 $957 $791
Impact of excluding Form 8-K items — — — — — — (105) —
Adjusted noninterest income 1 $765 $811 $874 $817 $795 $780 $852 $791
Noninterest expense $1,288 $1,264 $1,328 $1,280 $1,410 $1,259 $1,517 $1,357
Impact of excluding Form 8-K and
other legacy mortgage-related items — — — — (145) — (179) —
Adjusted noninterest expense 1 $1,288 $1,264 $1,328 $1,280 $1,265 $1,259 $1,338 $1,357
Diluted net income per average
common share $0.91 $1.00 $0.89 $0.78 $0.72 $1.06 $0.72 $0.73
Impact of excluding Form 8-K and
other legacy mortgage-related items — — — — 0.16 (0.25) 0.09 —
Adjusted diluted net income per
average common share 1 $0.91 $1.00 $0.89 $0.78 $0.88 $0.81 $0.81 $0.73