SunTrust 2015 Annual Report Download - page 81
Download and view the complete annual report
Please find page 81 of the 2015 SunTrust annual report below. You can navigate through the pages in the report by either clicking on the pages listed below, or by using the keyword search tool below to find specific information within the annual report.-
 1
1 -
2
-
3
-
4
-
5
-
6
-
7
-
8
-
9
-
10
-
11
-
12
-
13
-
14
-
15
-
16
-
17
-
18
-
19
-
20
-
21
-
22
-
23
-
24
-
25
-
26
-
27
-
28
-
29
-
30
-
31
-
32
-
33
-
34
-
35
-
36
-
37
-
38
-
39
-
40
-
41
-
42
-
43
-
44
-
45
-
46
-
47
-
48
-
49
-
50
-
51
-
52
-
53
-
54
-
55
-
56
-
57
-
58
-
59
-
60
-
61
-
62
-
63
-
64
-
65
-
66
-
67
-
68
-
69
-
70
-
 71
71 -
 72
72 -
 73
73 -
 74
74 -
 75
75 -
 76
76 -
 77
77 -
 78
78 -
 79
79 -
 80
80 -
 81
81 -
 82
82 -
 83
83 -
 84
84 -
 85
85 -
 86
86 -
 87
87 -
 88
88 -
 89
89 -
 90
90 -
 91
91 -
92
-
93
-
94
-
95
-
96
-
97
-
98
-
99
-
100
-
101
-
102
-
103
-
104
-
105
-
106
-
107
-
108
-
109
-
110
-
111
-
112
-
113
-
114
-
115
-
116
-
117
-
118
-
119
-
120
-
121
-
122
-
123
-
124
-
125
-
126
-
127
-
128
-
129
-
130
-
131
-
132
-
133
-
134
-
135
-
136
-
137
-
138
-
139
-
140
-
141
-
142
-
143
-
144
-
145
-
146
-
147
-
148
-
149
-
150
-
151
-
152
-
153
-
154
-
155
-
156
-
157
-
158
-
159
-
160
-
161
-
162
-
163
-
164
-
165
-
166
-
167
-
168
-
169
-
170
-
171
-
172
-
173
-
174
-
175
-
176
-
177
-
178
-
179
-
180
-
181
-
182
-
183
-
184
-
185
-
186
-
187
-
188
-
189
-
190
-
191
-
192
-
193
-
194
-
195
-
196
 |
 |

53
unfunded commitments, derivatives, securitizations, and certain
commercial and CRE loans.
A transition period applies to certain capital elements and
risk weighted assets. One of the more significant transitions
required by the Basel III Final Rule relates to the risk weighting
applied to MSRs, which will impact the CET1 ratio during the
transition period when compared to the CET1 ratio that is
calculated on a fully phased-in basis. Specifically, the fully
phased-in risk weight of MSRs is 250%, while the risk weight
to be applied during the transition period is 100%. The transition
period is applicable from January 1, 2015 through December 31,
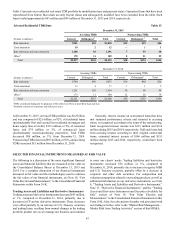
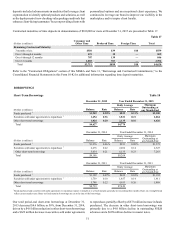
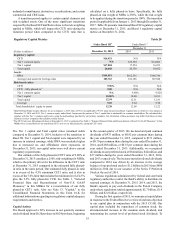
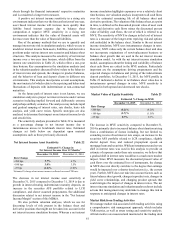
2017. Table 20 presents transitional Basel III regulatory capital
metrics at December 31, 2015, and Basel I regulatory capital
metrics at December 31, 2014.
Regulatory Capital Metrics Table 20
Under Basel III 1 Under Basel I 1
December 31, 2015
December 31
(Dollars in millions) 2014 2013
Regulatory capital:
CET1 $16,421 N/A N/A
Tier 1 common equity N/A $15,594 $14,602
Tier 1 capital $17,804 17,554 16,073
Total capital 20,668 20,338 19,052
Assets:
RWA $164,851 $162,516 $148,746
Average total assets for leverage ratio 183,763 182,186 167,848
Risk-based ratios:
CET1 9.96% N/A N/A
CET1 - fully phased-in 29.80 N/A N/A
Tier 1 common equity N/A 9.60% 9.82%
Tier 1 capital 10.80% 10.80 10.81
Total capital 12.54 12.51 12.81
Leverage 9.69 9.64 9.58
Total shareholders’ equity to assets 12.28 12.09 12.22
1 Basel III Final Rules became effective for us on January 1, 2015; thus, CET1 is not applicable ("N/A") under the previous Basel I capital rules to which we were subject at
December 31, 2014 and 2013. Tier 1 common equity under Basel I represents the portion of Tier 1 capital that is attributable to common shareholders. We calculated this,
together with the Tier 1 common equity ratio, using the methodology specified by our primary regulator. Our calculation of these measures may differ from those of other
financial services companies that calculate similar metrics.
2 The CET1 ratio on a fully phased-in basis at December 31, 2015 is estimated. See Table 1, "Selected Financial Data and Reconcilement of Non-U.S. GAAP Measures," in this
MD&A for a reconciliation of our transitional CET1 ratio to our fully phased-in, estimated CET1 ratio.
The Tier 1 capital and Total capital ratios remained stable
compared to December 31, 2014, inclusive of the transition to
Basel III. Tier 1 capital and Total capital were impacted by an
increase in retained earnings, while RWA was modestly higher
due to increased on- and off-balance sheet exposures. At
December 31, 2015, our capital ratios were well above current
regulatory requirements.
Our estimate of the fully phased-in CET1 ratio of 9.80% at
December 31, 2015 considers a 250% risk-weighting for MSRs,
which is the primary driver for the difference in the CET1 ratio
at December 31, 2015 compared to the estimated fully phased-
in ratio in the same period. Our estimated fully phased-in ratio
is in excess of the 4.5% minimum CET1 ratio, and is also in
excess of the 7.0% limit that includes the minimum level of 4.5%
plus the 2.5% fully phased-in CCB. See Table 1, "Selected
Financial Data and Reconcilement of Non-U.S. GAAP
Measures," in this MD&A for a reconciliation of our fully
phased-in CET1 ratio. Also see Note 13, "Capital," to the
Consolidated Financial Statements in this Form 10-K for
additional information regarding our regulatory capital adequacy
requirements and metrics.
Capital Actions
The Board approved a 20% increase in our quarterly common
stock dividend from $0.20 per share to $0.24 per share, beginning
in the second quarter of 2015. We declared and paid common
dividends of $475 million, or $0.92 per common share during
the year ended December 31, 2015, compared to $371 million,
or $0.70 per common share during the year ended December 31,
2014, and $188 million, or $0.35 per common share during the
year ended December 31, 2013. Additionally, we recognized
dividends on our preferred stock of $64 million, $42 million, and
$37 million during the years ended December 31, 2015, 2014,
and 2013, respectively. The increase in preferred stock dividends
compared to 2014 was driven by an increase in the average
balance of our preferred stock to $1.2 billion in 2015 from $800
million in 2014 due to our issuance of the Series F Preferred
Stock at the end of 2014.
Various regulations administered by federal and state bank
regulatory authorities restrict the Bank's ability to distribute its
retained earnings. At December 31, 2015, 2014, and 2013, the
Bank's capacity to pay cash dividends to the Parent Company
under these regulations totaled approximately $2.7 billion, $2.9
billion, and $2.6 billion, respectively.
During the first quarter of 2015, we announced capital plans
in response to the Federal Reserve's review of and non-objection
to our capital plan in conjunction with the 2015 CCAR. Our
capital plan included the repurchase of common stock, the
aforementioned increase in the common stock dividend, and
maintaining the current level of preferred stock dividends. To