SunTrust 2015 Annual Report Download - page 145
Download and view the complete annual report
Please find page 145 of the 2015 SunTrust annual report below. You can navigate through the pages in the report by either clicking on the pages listed below, or by using the keyword search tool below to find specific information within the annual report.-
 1
1 -
2
-
3
-
4
-
5
-
6
-
7
-
8
-
9
-
10
-
11
-
12
-
13
-
14
-
15
-
16
-
17
-
18
-
19
-
20
-
21
-
22
-
23
-
24
-
25
-
26
-
27
-
28
-
29
-
30
-
31
-
32
-
33
-
34
-
35
-
36
-
37
-
38
-
39
-
40
-
41
-
42
-
43
-
44
-
45
-
46
-
47
-
48
-
49
-
50
-
51
-
52
-
53
-
54
-
55
-
56
-
57
-
58
-
59
-
60
-
61
-
62
-
63
-
64
-
65
-
66
-
67
-
68
-
69
-
70
-
71
-
72
-
73
-
74
-
75
-
76
-
77
-
78
-
79
-
80
-
81
-
82
-
83
-
84
-
85
-
86
-
87
-
88
-
89
-
90
-
91
-
92
-
93
-
94
-
95
-
96
-
97
-
98
-
99
-
100
-
101
-
102
-
103
-
104
-
105
-
106
-
107
-
108
-
109
-
110
-
111
-
112
-
113
-
114
-
115
-
116
-
117
-
118
-
119
-
120
-
121
-
122
-
123
-
124
-
125
-
126
-
127
-
128
-
129
-
130
-
131
-
132
-
133
-
134
-
 135
135 -
 136
136 -
 137
137 -
 138
138 -
 139
139 -
 140
140 -
 141
141 -
 142
142 -
 143
143 -
 144
144 -
 145
145 -
 146
146 -
 147
147 -
 148
148 -
 149
149 -
 150
150 -
 151
151 -
 152
152 -
 153
153 -
 154
154 -
 155
155 -
156
-
157
-
158
-
159
-
160
-
161
-
162
-
163
-
164
-
165
-
166
-
167
-
168
-
169
-
170
-
171
-
172
-
173
-
174
-
175
-
176
-
177
-
178
-
179
-
180
-
181
-
182
-
183
-
184
-
185
-
186
-
187
-
188
-
189
-
190
-
191
-
192
-
193
-
194
-
195
-
196
 |
 |

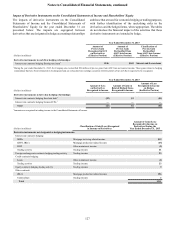
Notes to Consolidated Financial Statements, continued
117
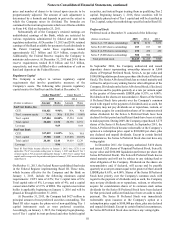
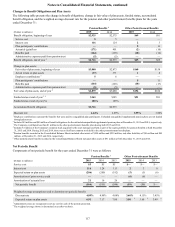
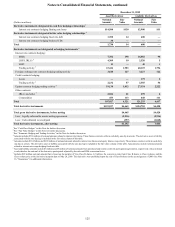
Changes in Benefit Obligations and Plan Assets
The following table presents the change in benefit obligations, change in fair value of plan assets, funded status, accumulated
benefit obligation, and the weighted average discount rate for the pension and other postretirement benefits plans for the years
ended December 31:
Pension Benefits 1Other Postretirement Benefits
(Dollars in millions) 2015 2014 2015 2014
Benefit obligation, beginning of year $2,935 $2,575 $69 $81
Service cost 55——
Interest cost 116 124 23
Plan participants’ contributions ——611
Actuarial (gain)/loss (171) 401 (2) (10)
Benefits paid (164) (165) (10) (16)
Administrative expenses paid from pension trust (5) (5) ——
Benefit obligation, end of year 2$2,716 $2,935 $65 $69
Change in plan assets:
Fair value of plan assets, beginning of year $3,080 $2,873 $160 $158
Actual return on plan assets (37) 371 18
Employer contributions 356——
Plan participants’ contributions ——511
Benefits paid (164) (165) (10) (17)
Administrative expenses paid from pension trust (5) (5) ——
Fair value of plan assets, end of year 4$2,879 $3,080 $156 $160
Funded status at end of year 5, 6 $163 $145 $91 $91
Funded status at end of year (%) 106% 105%
Accumulated benefit obligation $2,716 $2,935
Discount rate 4.44% 4.09% 3.95% 3.60%
1 Employer contributions represent the benefits that were paid to nonqualified plan participants. Unfunded nonqualified supplemental pension plans are not funded
through plan assets.
2 Includes $81 million and $85 million of benefit obligations for the unfunded nonqualified supplemental pension plans at December 31, 2015 and 2014, respectively.
3 The Company contributed less than $1 million to the other postretirement benefits plans during both 2015 and 2014.
4 Includes $1 million of the Company's common stock acquired by the asset manager and held as part of the equity portfolio for pension benefits at both December
31, 2015 and 2014. During 2015 and 2014, there was no SunTrust common stock held in the other postretirement benefit plans.
5 Pension benefits recorded in the Consolidated Balance Sheets included other assets of $244 million and $230 million, and other liabilities of $81 million and $85
million, at December 31, 2015 and 2014, respectively.
6 Other postretirement benefits recorded in the Consolidated Balance Sheets included other assets of $91 million at both December 31, 2015 and 2014.
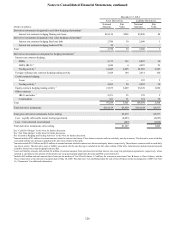
Net Periodic Benefit
Components of net periodic benefit for the years ended December 31 were as follows:
Pension Benefits 1Other Postretirement Benefits
(Dollars in millions) 2015 2014 2013 2015 2014 2013
Service cost $5 $5 $5 $— $— $—
Interest cost 116 124 113 23 6
Expected return on plan assets (206) (200) (192) (5) (5) (6)
Amortization of prior service credit —— — (6) (6) —
Amortization of actuarial loss 21 16 26 —— —
Net periodic benefit ($64) ($55) ($48) ($9) ($8) $—
Weighted average assumptions used to determine net periodic benefit:
Discount rate 4.09% 4.98% 4.08% 3.60% 4.15% 3.45%
Expected return on plan assets 6.91 7.17 7.00 3.50 23.68 23.49 2
1 Administrative fees are recognized in service cost for each of the periods presented.
2 The weighted average shown is determined on an after-tax basis.